Wall Street Memes (WSM/USD) Trade Swings Low, Holding Hikes
Estimated Reading Time: 3 minutes
Don’t invest unless you’re prepared to lose all the money you invest. This is a high-risk investment and you are unlikely to be protected if something goes wrong. Take 2 minutes to learn more
Wall Street Memes Price Prediction – January 16
Efforts have persistently been made by long-position movers in the business dealings that paired Wall Street Memes with the exchanging worth of the American currency, as the current trade outlook shows that the crypto economy swings low, holding hikes above the point of $0.00075.
If buyers in the WSM/USD market neglect to use pending position orders, i.e., buy limits, it may be a bit tiresome to trade strategies to wait for a touch of the trading region around the lower Bollinger Band before executing immediate purchasing orders. Even if that assumption is false, it is still a favorable opportunity for capitalists to increase their bets before strong recoveries that may appear quickly.
WSM/USD Market
Key Levels
Resistance levels: $0.0012, $0.0017, $0.0022
Support levels: $0.0007, $0.0005, $0.0003
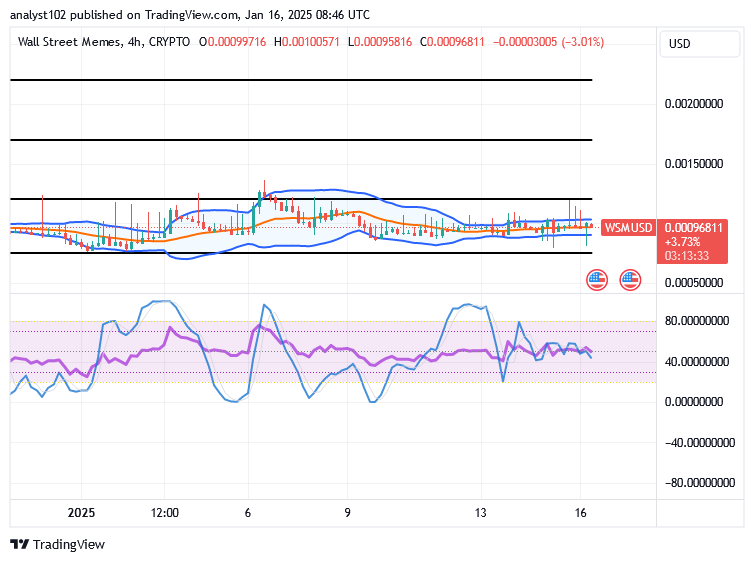
WSM/USD – 4-hour Chart
The WSM/USD 4-hour chart of the WSM/USD market reveals the crypto economy swings low, holding hikes in inputs.
In order to show that the trade is strongly pushing in ranges, the stochastic oscillators’ movement arrangement setting has been simultaneously veering about through variation closing positions between the 80 and 40 places. The Bollinger Bands have stayed stretched, mostly around the $0.001 value line, with their trend lines pointing east.
Should sellers in the WSM/USD market be cautious about following falls that seek to form the Bollinger Bands?
It is ideally psychological for the WSM/USD trade short-position pushers to stay off from pushing alongside some attempted falls in the zones of the indicators of the Bollinger Bands, given that the base instrument swings low, holding hikes.
However, as of right now, both buyers and investors are technically free to continue using purchasing and holding strategies based on the long-term trend. Hopefully, by doing this, the crypto basement will quickly or eventually gain the much-needed strength to sustain their subsequent advances to the moon side.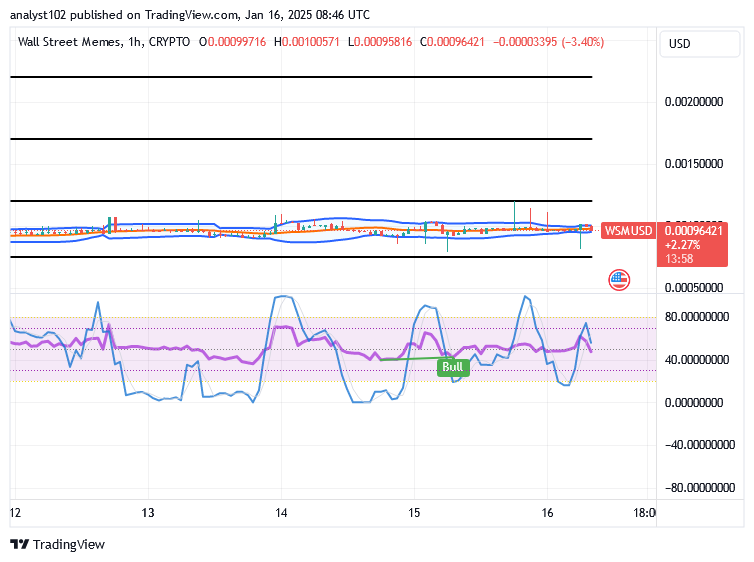
WSM/USD 1-hour chart
The 1-hour chart showcases that the WSM/USD market currently swings low, holding hikes above the point of $0.00075.
The hourly trade chart’s overall settings demonstrate that the stochastic oscillators’ movement pattern has produced a positive indication. The indicators of the Bollinger Bands are still extending their paths in an easterly direction. We advise placing more long position orders right away before the counter instrument completely gives up.
Buy and stake WSM now!: Wall Street Meme (WSM)