My Neighbor Alice (ALICE/USD) Shows Signs of Bullish Resurgence
Estimated Reading Time: 3 minutes
Don’t invest unless you’re prepared to lose all the money you invest. This is a high-risk investment and you are unlikely to be protected if something goes wrong. Take 2 minutes to learn more
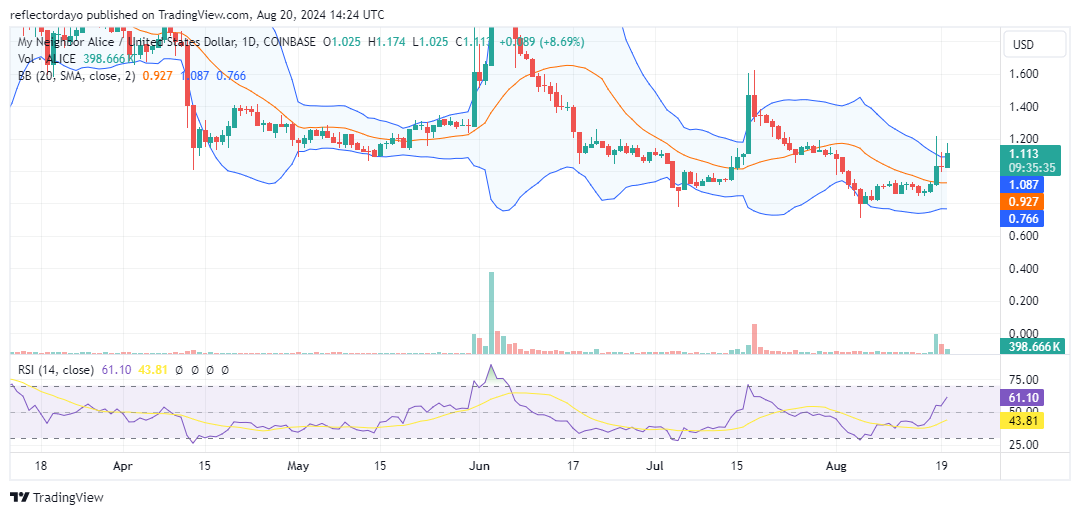
My Neighbor Alice reached its annual high at approximately $2.80, climbing from a price level of $1.00 in June. Following this significant achievement, the market entered a prolonged downward trend. Despite this decline, the resistance level held firm. Over time, increasing bearish pressure pushed the demand line slightly below the $1.00 mark. Currently, the market is at $0.80, with bullish momentum driving prices upward.
My Neighbor Alice Market Data
- ALICE/USD Price Now: $1.107
- ALICE/USD Market Cap: $75 million
- ALICE/USD Circulating Supply: 68 million ALICE
- ALICE/USD Total Supply: 100 million ALICE
- ALICE/USD CoinMarketCap Ranking: #395
Key Levels
- Resistance: $1.200, $1.400, and $1.600.
- Support: $1.000, $0.900, and $0.800.
Price Analysis for My Neighbor Alice: The Indicators’ Point of View
As bearish pressure pushed the market below the $1.00 price level, this level typically becomes dominated by bearish sentiment. However, due to traders maintaining a bullish bias around $1.00, the level was quickly reclaimed by the bulls. Currently, the bulls are aiming for a breakout at $1.160, a significant resistance level. A successful breakout here could attract additional bullish sentiment from traders. However, the presence of upper shadows on the last three candlesticks indicates that resistance at this level is rejecting bullish momentum. The Bollinger Bands indicator is trending downward, with the price nearing the upper resistance line. Traders should closely monitor this potential breakout in the crypto signal here, as it could shift the market direction back to the upside.
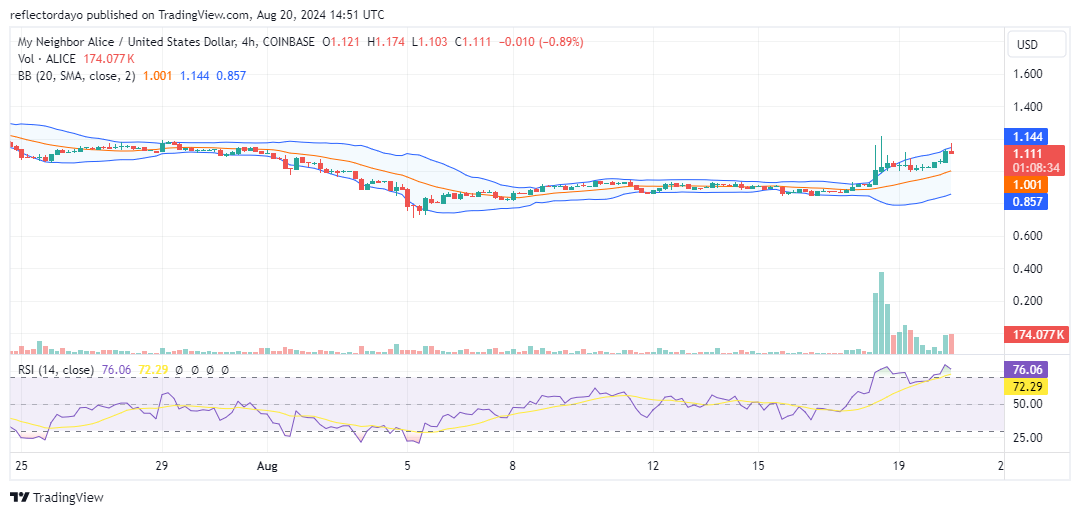
ALICE/USD 4-Hour Chart Outlook
The market analysis from the perspective of the 4-hour chart presents a different scenario. While the daily chart highlights the bulls’ efforts to push the market upward, the 4-hour chart indicates a weakening in bullish momentum. This suggests the possibility that the market may start to decline around this key resistance level. The Volume of Trade indicator shows a decrease in histogram height, signaling a reduction in bullish momentum. Additionally, with the RSI line now above the 70 level, there is an increased likelihood of a market downturn. However, bullish momentum could potentially resume around the $1.00 level.