RSI Indicator in Crypto Trading: A Beginner’s Guide
Estimated Reading Time: 3 minutes
Don’t invest unless you’re prepared to lose all the money you invest. This is a high-risk investment and you are unlikely to be protected if something goes wrong. Take 2 minutes to learn more
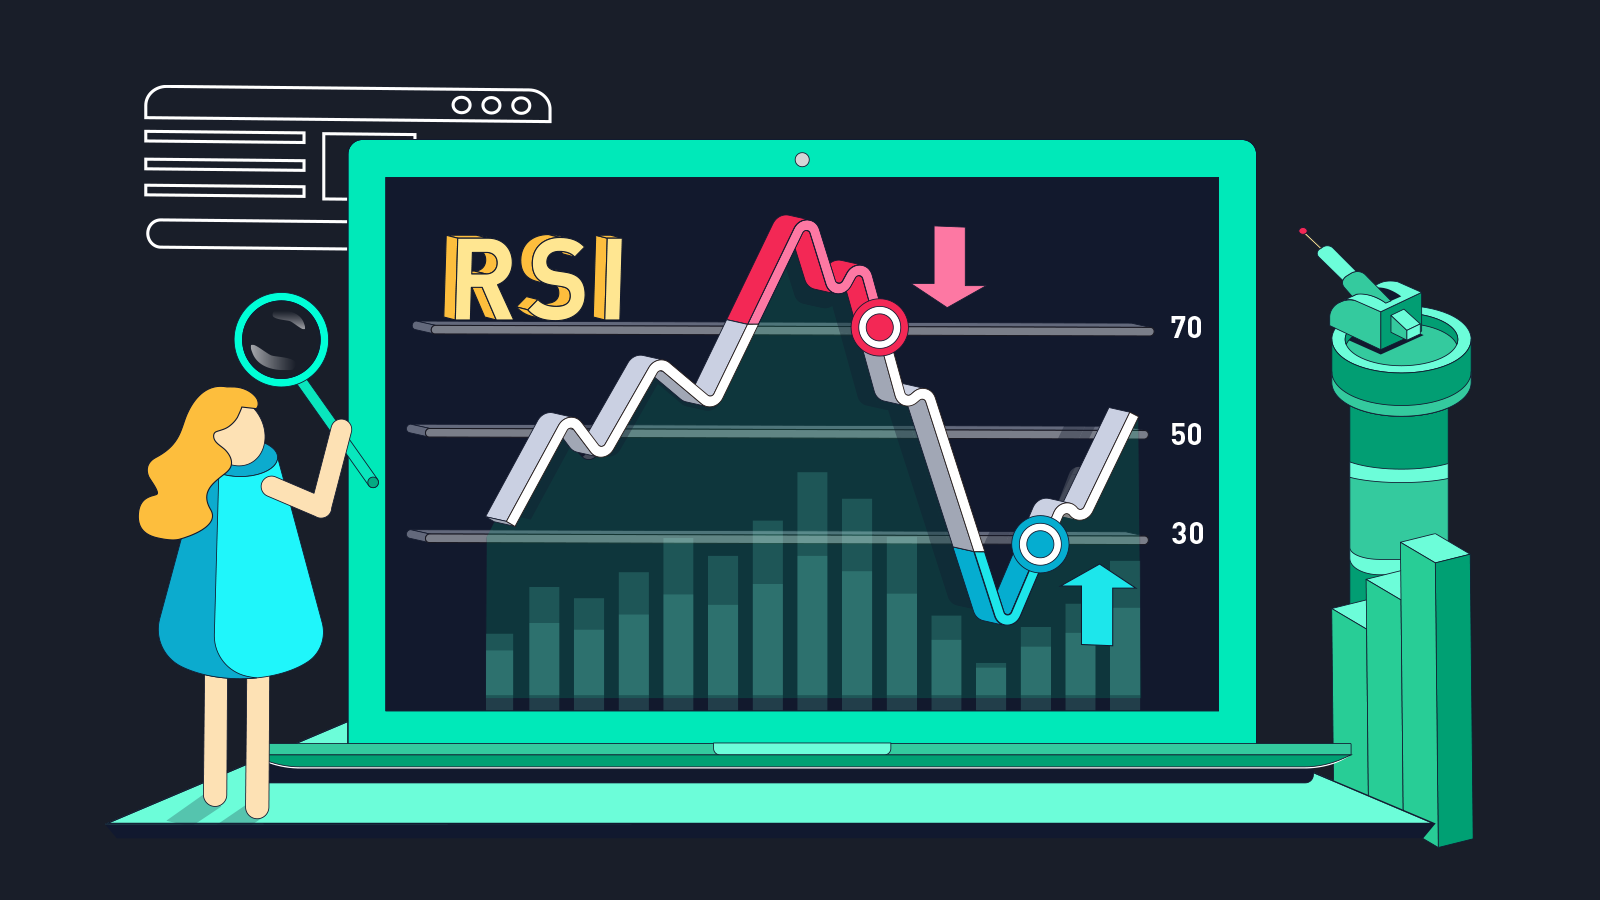
The Relative Strength Index, usually called RSI, is one of the most popular indicators in crypto trading. It helps traders judge momentum and identify when a market may be overextended.
Like any indicator, RSI is not magic. But when used correctly, it can add useful context to a trade setup.
What Is RSI?
RSI is a momentum indicator that moves between 0 and 100. It measures the speed and size of recent price movements.
Traditionally, readings above 70 are considered overbought, while readings below 30 are considered oversold.
Overbought does not automatically mean sell. Oversold does not automatically mean buy. It simply means price has moved strongly in one direction.
 Most Popular
- 2-5 Signals Daily
- 82% Success Rate
- Entry, Take Profit & Stop Loss
- Amount To Risk Per Trade
- Risk Reward Ratio


RSI in Trending Markets
One of the biggest mistakes beginners make is shorting every overbought RSI reading. In a strong uptrend, RSI can stay overbought for a long time while price keeps rising.
The same is true in reverse. In a strong downtrend, RSI can stay oversold while price keeps falling.
This is why trend matters. RSI signals work best when combined with market structure.
Using RSI for Pullbacks
In an uptrend, traders may watch RSI pull back from high levels and reset before price continues higher. In a downtrend, RSI may bounce from oversold levels before sellers return.
Instead of using RSI as a standalone entry, use it to understand momentum.
RSI Divergence
Divergence is one of the more useful RSI concepts.
Bullish divergence happens when price makes a lower low, but RSI makes a higher low. This can suggest downside momentum is weakening.
Bearish divergence happens when price makes a higher high, but RSI makes a lower high. This can suggest upside momentum is fading.
Divergence does not guarantee a reversal, but it can warn that the current move is losing strength.

Free Crypto Signals Channel
 Free Telegram Channel
Best Practices
Use RSI with support and resistance. An oversold RSI at a major support level is more interesting than oversold RSI in the middle of nowhere.
Use RSI with trend. Signals that align with the larger trend are usually cleaner.
Do not rely on RSI alone. It is one tool, not the whole toolbox.
The Bottom Line
The RSI indicator can help crypto traders read momentum, spot overextended moves and identify possible divergence.
But RSI should never replace risk management or market structure. Use it as confirmation, not as a reason to blindly enter a trade.
Need help applying this to live market conditions? Get instant access to our VIP trading signals here.