SPONGE/USD ($SPONGE) Stabilizes Around $0.00007—Signs of a Potential Rebound
Estimated Reading Time: 3 minutes
Don’t invest unless you’re prepared to lose all the money you invest. This is a high-risk investment and you are unlikely to be protected if something goes wrong. Take 2 minutes to learn more

After slipping below previous support near the $0.000078 region, $SPONGE has found stability around the $0.00007 threshold. The market now appears to be consolidating within this zone, suggesting that selling pressure may be tapering off. Several doji candlesticks have emerged near this level, signaling indecision and hinting that buyers may be quietly re-entering the market.
This price behavior typically precedes a potential shift in momentum, and if the $0.00007 support remains intact, it could serve as a springboard for a short-term upside move. On the flip side, a clear break beneath this level might expose the market to deeper declines before any recovery can take hold.
Key Levels to Watch:
- Resistance: $0.000115, $0.000120, $0.000130
- Support: $0.000075, $0.000070, $0.000065
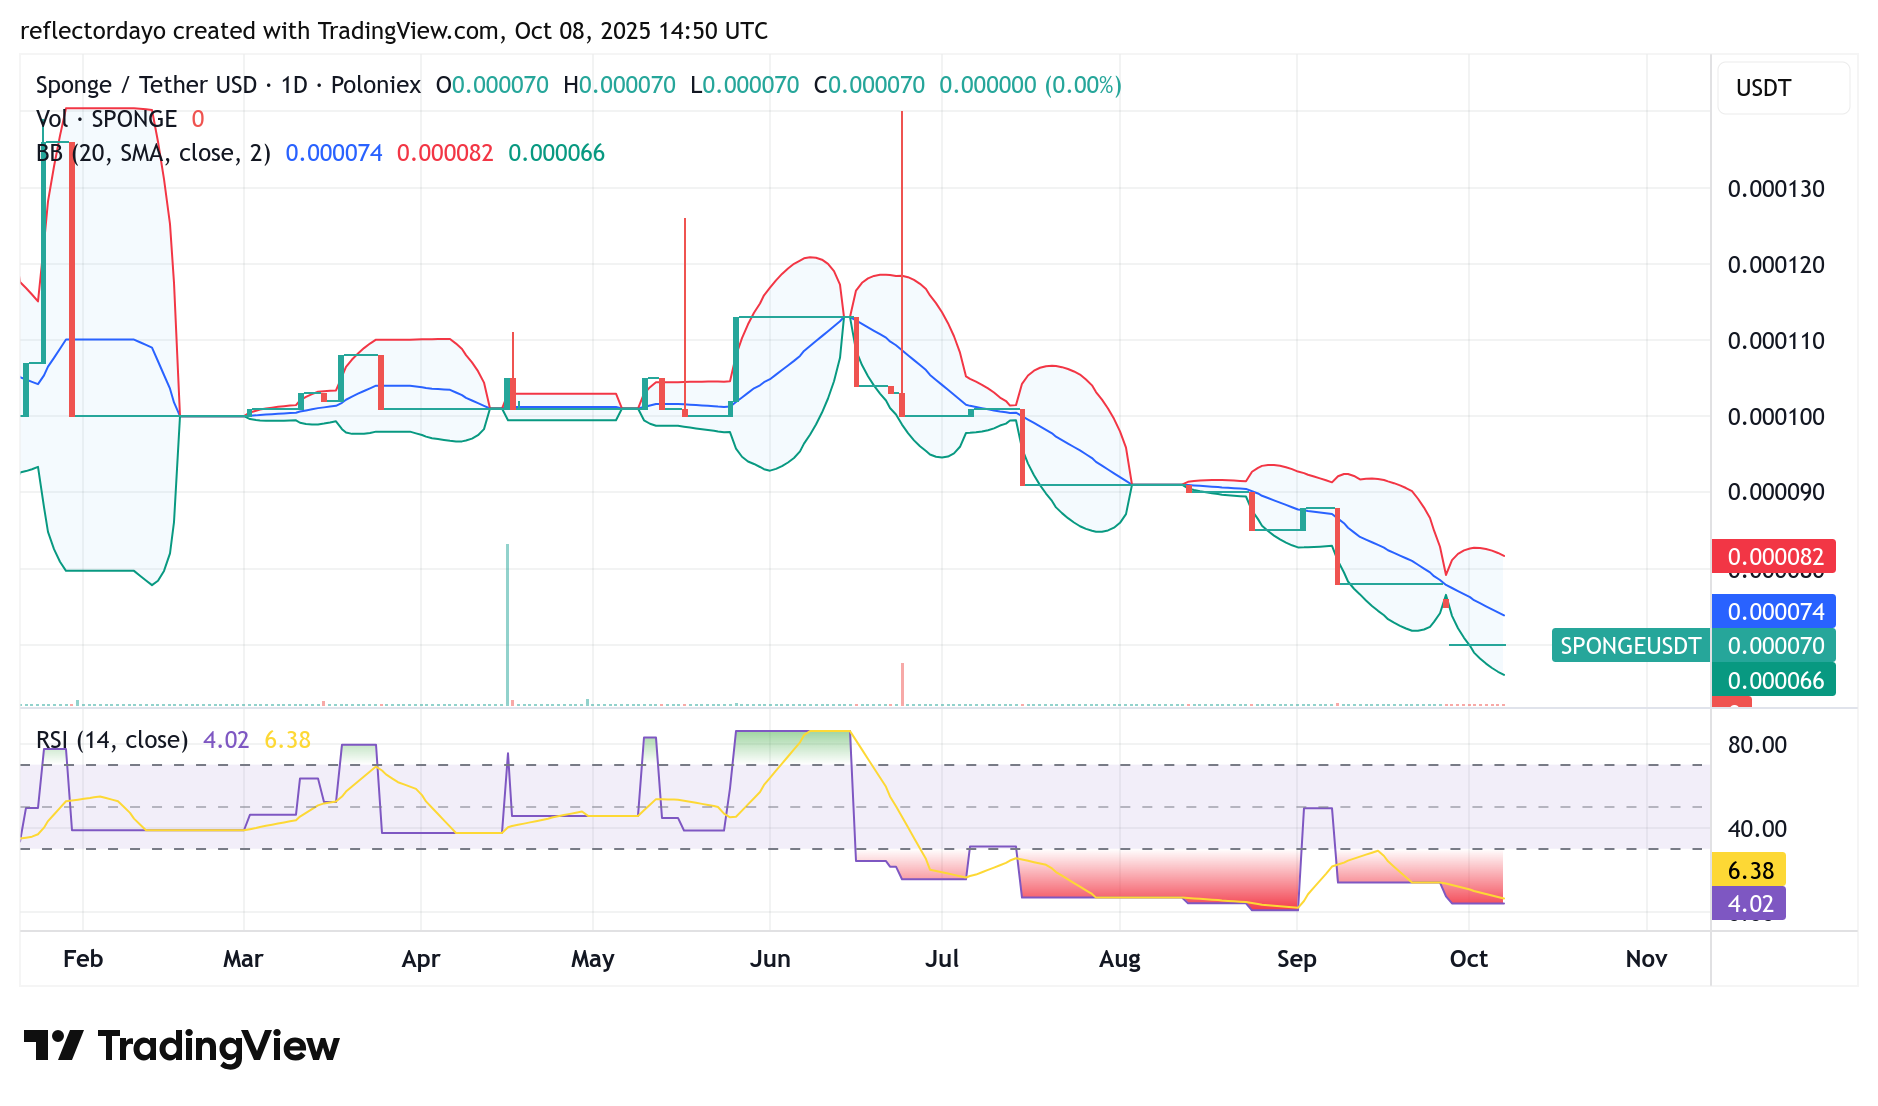
SPONGE/USD Daily Chart: Oversold Conditions Hint at a Potential Recovery
The daily chart reveals that $SPONGE continues to trade deep within oversold territory. The RSI has dipped as low as level 4, underscoring the intensity of the recent bearish trend. However, such extreme readings often precede a market reversal, as traders begin eyeing undervalued zones for potential entry points.
This setup could attract speculative buying, prompting a relief rally in the sessions ahead. If bullish momentum strengthens, the price may rebound sharply as traders capitalize on current volatility. As October unfolds, a shift in sentiment could spark renewed optimism, provided that volume confirms the move.
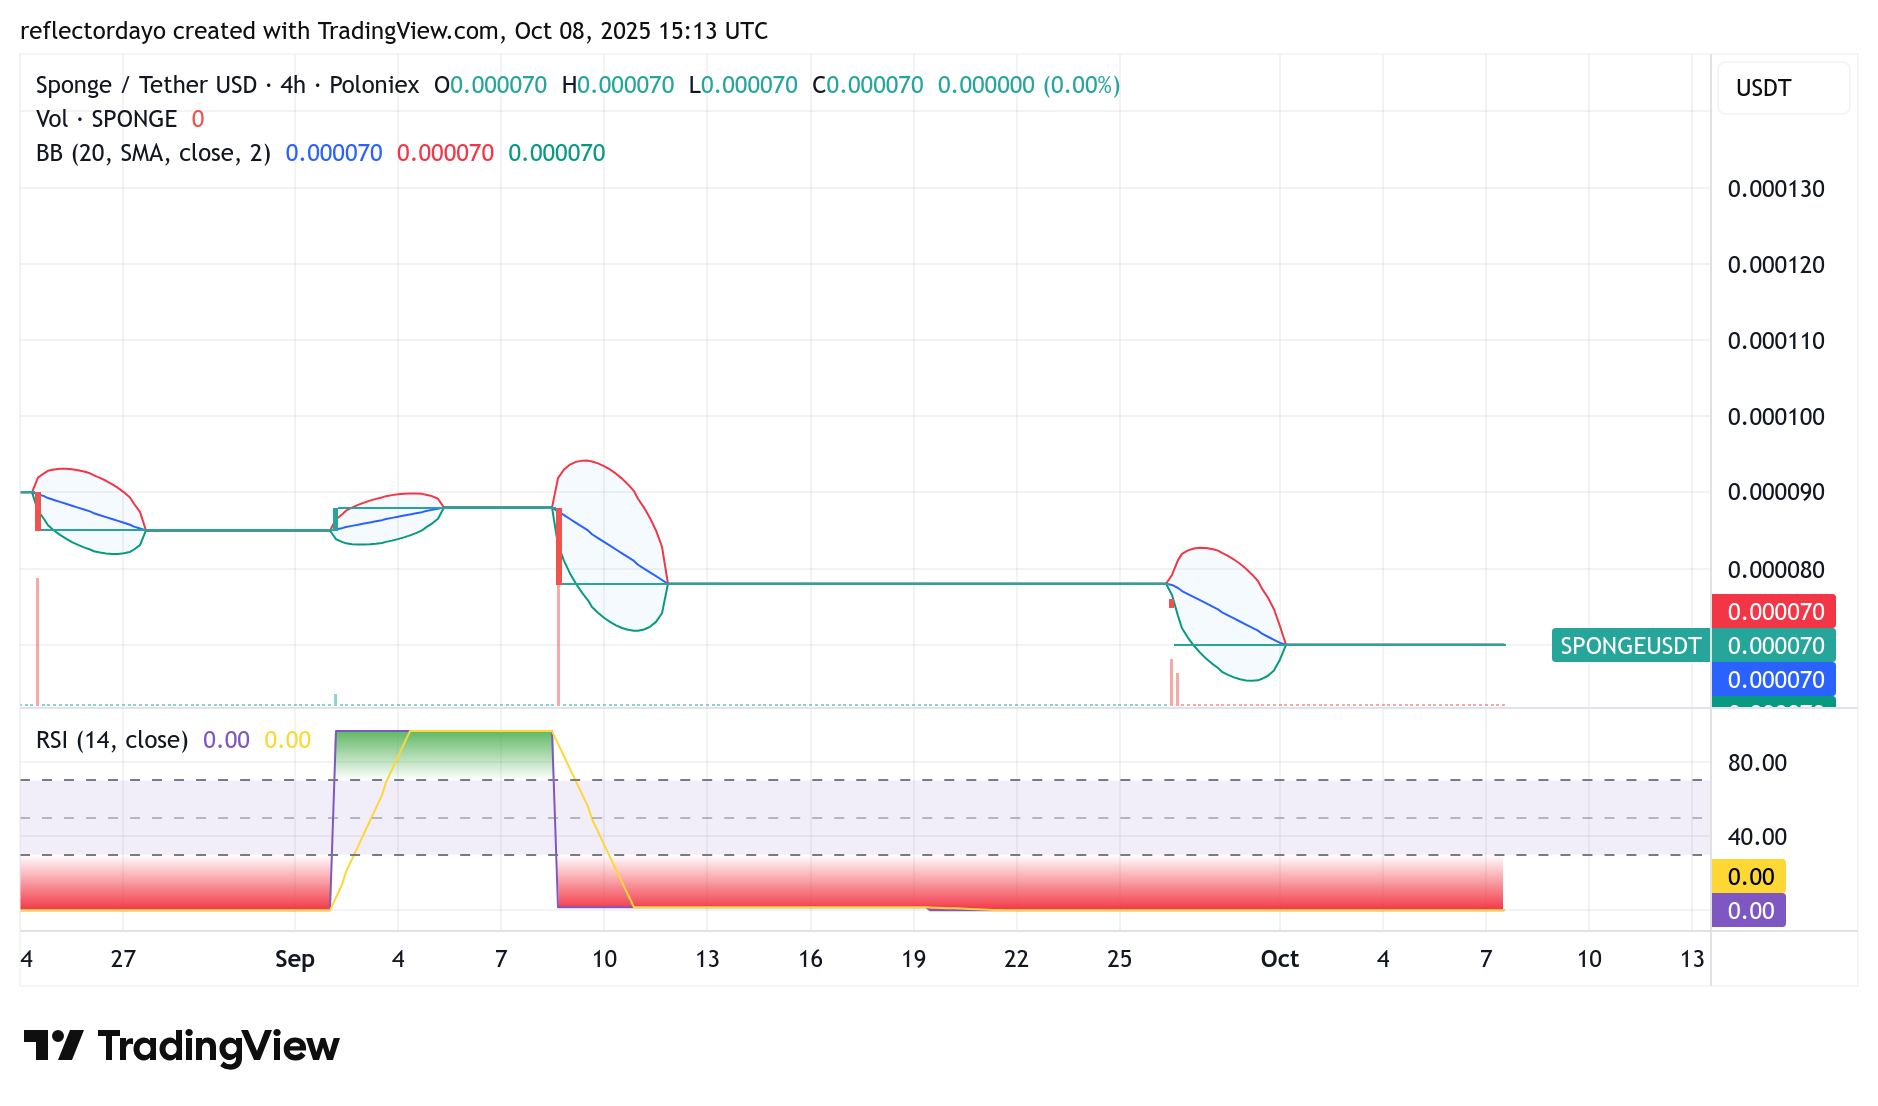
SPONGE/USD 4-Hour Chart: Compression Phase Signals a Pending Move
On the 4-hour timeframe, SPONGE/USD is consolidating within a narrow band as the Bollinger Bands tighten—a technical cue that volatility expansion may be imminent. The slowdown in bearish activity suggests that sellers may be losing control, while bullish traders are gradually accumulating positions.
A confirmed breakout above the consolidation zone could trigger a fresh upward drive, potentially revisiting resistance levels at $0.000078 and $0.000115. However, failure to maintain this momentum may keep the pair locked in its current range until a stronger catalyst emerges to define direction.
Buy $SPONGE!
GEN Z DAMP 💦💦 pic.twitter.com/ZsQ0WB4ok4
— $SPONGE (@spongeoneth) October 8, 2025
Join the SPONGE community and get in on the next big crypto opportunity! Buy Sponge ($SPONGE) today