On-Chain Analysis: Reading the Blockchain Like a Pro
Estimated Reading Time: 6 minutes
Don’t invest unless you’re prepared to lose all the money you invest. This is a high-risk investment and you are unlikely to be protected if something goes wrong. Take 2 minutes to learn more

The Data Hidden in Plain Sight
Most investors look at price charts. On-chain analysts look deeper — at the actual data recorded on the blockchain itself.
Every transaction, every wallet movement, every coin that changes hands is permanently recorded and publicly accessible. On-chain analysis is the art of reading that data to understand what’s really happening in the market.
What Is On-Chain Analysis?
On-chain analysis is the study of blockchain data — transactions, wallet addresses, token flows, and network activity — to gain insights into market conditions and investor behaviour.
Unlike technical analysis (which looks at price and volume) or fundamental analysis (which evaluates a project’s value), on-chain analysis reads the actual behaviour of market participants at the transaction level.
It’s like being able to see inside every bank account on earth — not who owns them, but exactly what’s moving, where, and when.

Free Crypto Signals Channel
Why On-Chain Data Is Powerful
Traditional financial markets have insider trading laws because information asymmetry creates unfair advantages. In crypto, all data is public — but most people don’t know how to read it.
On-chain analysis can reveal:
– Whether long-term holders are accumulating or distributing
– Whether miners are selling their Bitcoin
– How much Bitcoin is sitting on exchanges (ready to sell)
– Whether large wallets (“whales”) are moving funds
– Whether retail or institutional investors are dominant
Key On-Chain Metrics Explained
Exchange Flows
Tracks Bitcoin (or other assets) moving onto or off exchanges.
– Inflows (into exchanges): Suggests holders may be preparing to sell → bearish
– Outflows (off exchanges): Suggests holders moving to cold storage for long-term holding → bullish
When Bitcoin consistently leaves exchanges, it signals decreasing sell pressure.
HODL Waves
Shows the age of the Bitcoin being moved. Each “wave” represents Bitcoin that was last moved at a specific time period.
– Old coins moving (held 1–5+ years): Long-term holders distributing → often signals market tops
– Young coins dominant: Active trading and speculation → often seen in bull markets
When old coins go dormant and young coins dominate, smart money is sitting tight.
MVRV Ratio (Market Value to Realised Value)
Compares Bitcoin’s current market cap to its “realised cap” — what the market paid for all coins at their last transaction.
– MVRV > 3.5: Market significantly overvalued → historically near market tops
– MVRV < 1: Market below cost basis → historically strong buying opportunities
– MVRV 1–3.5: Fair to slightly overvalued range
MVRV is one of the most reliable macro signals in Bitcoin analysis.
Realised Price
The average price at which all Bitcoin was last transacted. Essentially the market’s aggregate cost basis.
When Bitcoin’s price falls below the Realised Price, the average holder is at a loss — a historically rare condition that often marks market bottoms.
Puell Multiple
Measures daily miner revenue against its yearly moving average. Used to assess whether miners are under stress (potentially forced to sell).
– High Puell Multiple: Miners earning well above average → potential sell pressure
– Low Puell Multiple: Miners under stress → historically near market bottoms
Net Unrealised Profit/Loss (NUPL)
Shows the overall profit/loss state of the market:
| NUPL Value | Market State |
|---|---|
| > 0.75 | Euphoria — most holders in heavy profit |
| 0.5 – 0.75 | Belief/Greed |
| 0.25 – 0.5 | Optimism/Hope |
| 0 – 0.25 | Capitulation area |
| < 0 | Surrender/Bottom territory |
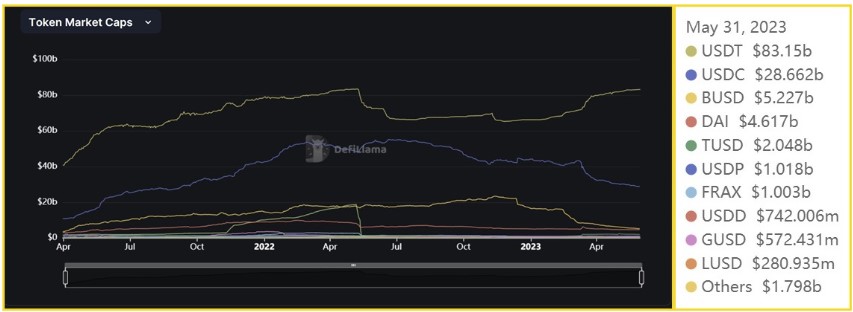
Supply on Exchanges
What percentage of all Bitcoin is held on centralised exchanges?
– Rising exchange supply: More holders ready to sell → bearish
– Falling exchange supply: More holders self-custodying → bullish
Post-FTX, exchange supply hit multi-year lows as users moved to self-custody — a structurally bullish signal.
Whale Activity
Large wallet movements can signal major market moves. On-chain tools track wallets holding large amounts of Bitcoin and alert when they move funds.
Metrics like “Whale to Exchange” flows can give early warning of potential sell-offs.
Where to Access On-Chain Data
| Platform | What It Offers |
|---|---|
| Glassnode | The most comprehensive on-chain analytics platform (paid) |
| CryptoQuant | Exchange flows, miner data, whale tracking |
| IntoTheBlock | Simplified on-chain metrics with visual dashboards |
| Lookonchain | Real-time whale wallet tracking (free, Twitter/X active) |
| Blockchain.com / Mempool.space | Raw blockchain explorers |
| Dune Analytics | Custom on-chain queries (for advanced users) |
Limitations of On-Chain Analysis
– Addresses aren’t identities: A single entity can control thousands of wallets
– Exchange wallets complicate readings: Exchanges pool customer funds, distorting data
– Lagging indicator: On-chain data shows what happened — not always what will happen
– Not foolproof: Like any analysis method, it can produce false signals
On-chain analysis is best used alongside technical and fundamental analysis — not in isolation.
 Most Popular
- 2-5 Signals Daily
- 82% Success Rate
- Entry, Take Profit & Stop Loss
- Amount To Risk Per Trade
- Risk Reward Ratio
Key Takeaways
– On-chain analysis reads blockchain data to understand real investor behaviour
– Key metrics: Exchange flows, MVRV, Realised Price, NUPL, Puell Multiple
– Exchange outflows and low MVRV have historically been strong buy signals
– Old coins moving often signals distribution by long-term holders (bearish)
– Best used alongside TA and FA for a complete market picture
The Bottom Line
On-chain analysis gives you a window into the market that price charts alone can’t provide. While it requires some learning, the core metrics are accessible — and even a basic understanding of exchange flows and MVRV can significantly improve your market timing.
In a market where everyone sees the same price charts, those who understand the on-chain data have a genuine information edge.
NOT FINANCIAL ADVICE. On-chain metrics are tools for analysis, not guarantees of future price movements. Always do your own research (DYOR).