Avalanche Price Prediction: AVAX/USD Moves Around $13.97 Level
Estimated Reading Time: 2 minutes
Don’t invest unless you’re prepared to lose all the money you invest. This is a high-risk investment and you are unlikely to be protected if something goes wrong. Take 2 minutes to learn more
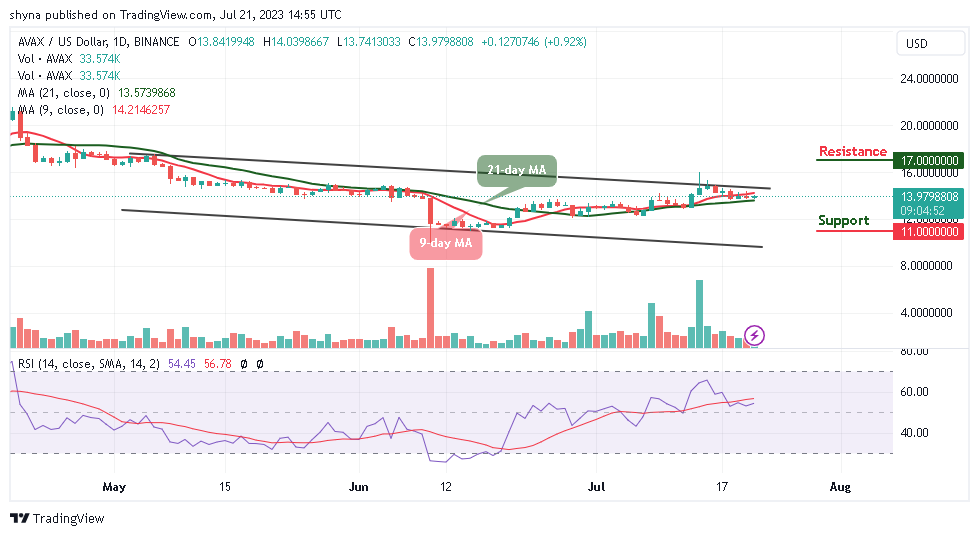
Avalanche Price Prediction – July 21
The Avalanche price is seen moving within the 9-day and 21-day moving averages to hit the $14.00 resistance level.
AVAX/USD Market
Key Levels:
Resistance levels: $17.00, $18.0, $19.00
Support levels: $11.00, $10.00, $9.10
AVAX/USD bulls are trying to push the coin above the 9-day moving average. The technical indicator Relative Strength Index (14) reveals that the market may embark on a positive movement as the signal line moves to cross above the 60-level.
Avalanche Price Prediction: AVAX Price May Follow the Uptrend
The Avalanche price is changing hands at $13.97 where it faces up. Moreover, if the coin breaks the $14.00 resistance level, the coin may continue its upward movement to cross above the upper boundary of the channel. Therefore, the nearest resistance levels could be located at $17.00, $18.00, and $19.00 while heading toward the lower boundary of the channel may reach the support levels at $11.00, 10.00, and $9.10.
AVAX/USD Medium-Term Trend: Ranging (4H Chart)
According to the 4-hour chart, the Avalanche price is heading to cross above the 9-day and 21-day moving averages as the bulls may push the coin to the positive side. On the downside, if the market price nosedives and slides below the lower boundary of the channel, the next support level may surface at 13.00 SAT to locate further key support at $12.00 and below if the sell-off later becomes huge.
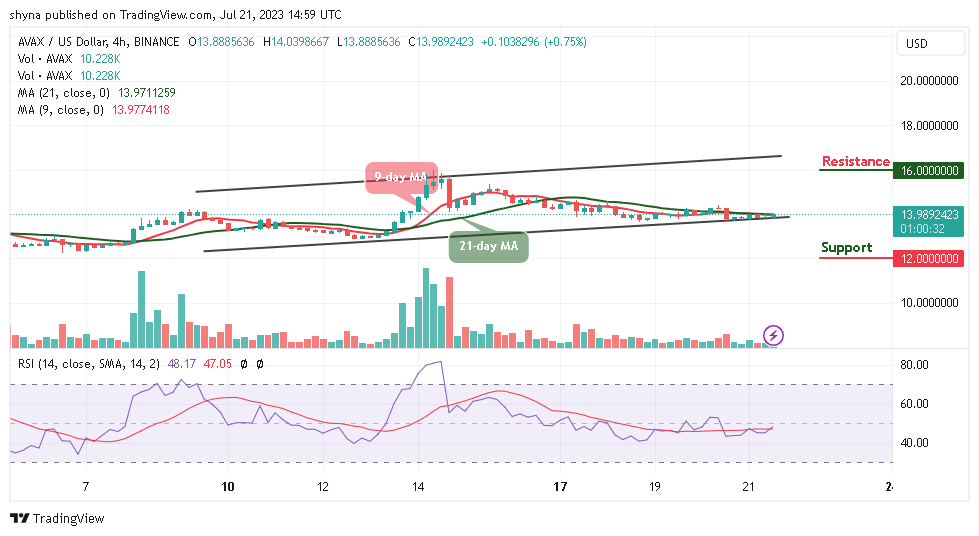
However, on the upside, if the bulls push the price back above the moving averages; Avalanche could face the upper boundary of the channel. Further bullish movement may hit the potential resistance level at $16.00 and above while the signal line of the Relative Strength Index (14) moves to cross above the 50 level to continue the bullish movement. On the other hand, if it moves below this level, it may bring bearish pressure into the market.
You can purchase Avalanche here. Buy AVAX