Band Protocol (BANDUSD) Steps in a Downward Direction
Estimated Reading Time: 2 minutes
Don’t invest unless you’re prepared to lose all the money you invest. This is a high-risk investment and you are unlikely to be protected if something goes wrong. Take 2 minutes to learn more

Free Crypto Signals Channel
 Free Telegram Channel
Band Protocol Analysis – The market steps in a downward direction
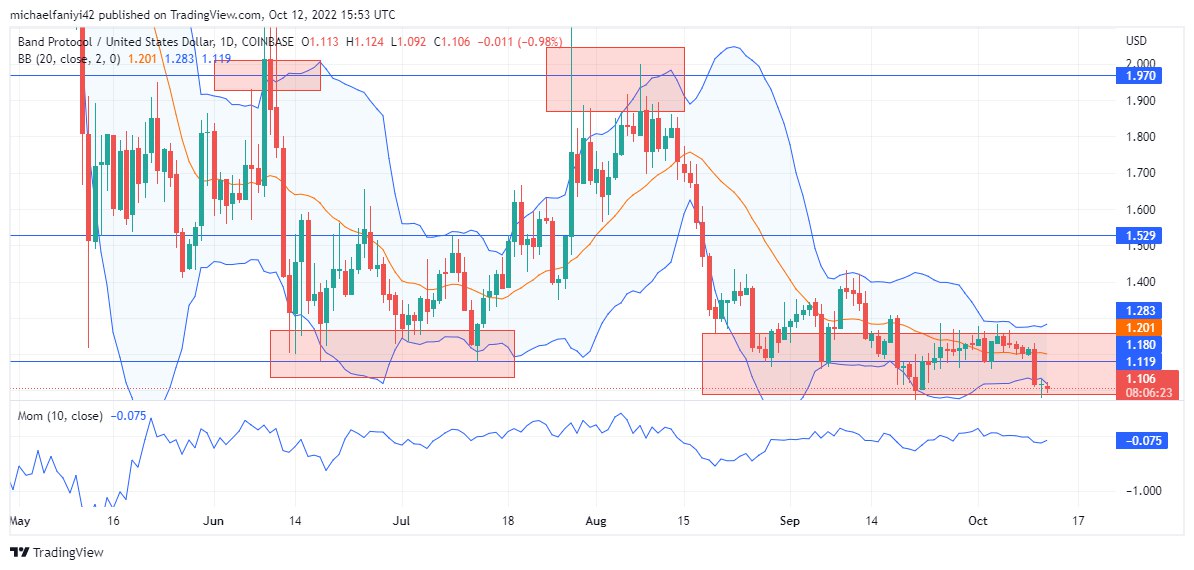
Band Protocol steps in a downward direction. The market has struggled with the bearish influence that has impacted the market until now. The price initially rested above the significant $1.529 level, but, not too long after, just before the 14th of October, the price dropped further downward. Several days later, the coin still has a bearish orientation.
Band Protocol Key Zones
Resistance Zones: $1.246, $1.970
Support Zones: $1.119, $1.180
BANDUSD is struggling to stay afloat after it stepped downward in a bearish direction. The market has been bouncing between the significant levels a bit to drum up momentum, which will push it upward. However, this hasn’t worked out as expected. Instead, the buyers have weakened, allowing the sellers to regain control, and push the price below $1.180.
When the coin was initially found undulating within the key levels of $1.970 as resistance and $1.180 as support, the market’s momentum decreased as the coin plummeted. It has only recovered a little as the price settled above $1.180. The Momentum indicator is moving in a sideways trend. Notwithstanding, the coin has dropped a little lower than $1.180.
Market Expectation
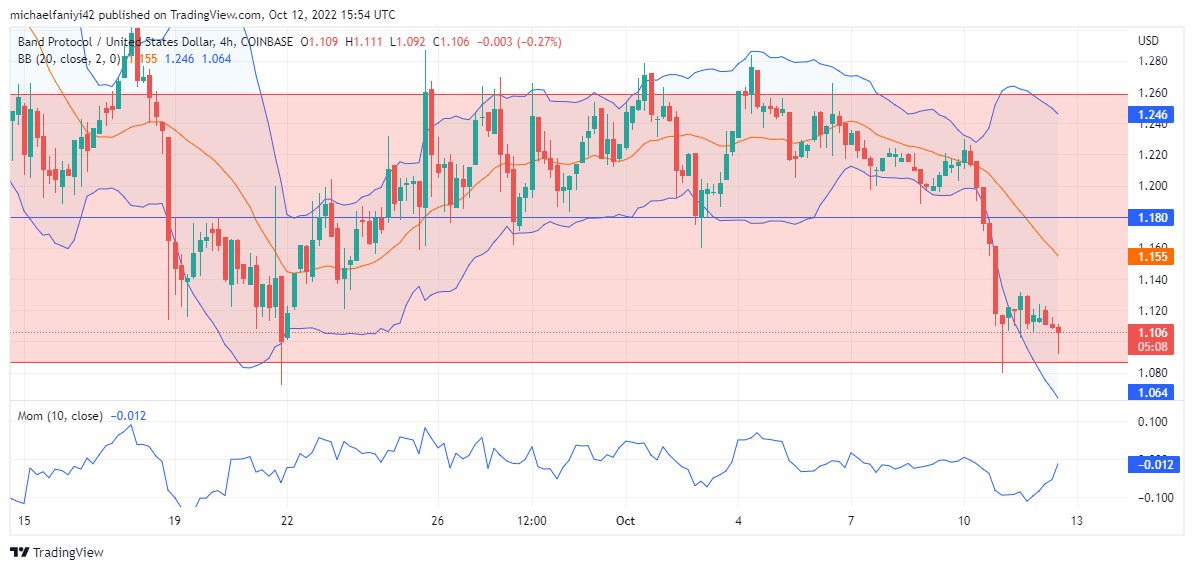
The 4-hour chart shows that the market has limited its scope of movement between $1.246 as resistance and 1.119 as support. The upper Bollinger Band is also limiting the upward mobility of the price. And so, the price has now dropped below $1.119. There is more propensity for the market to drop even lower beyond this level and reach the next level.
You can purchase Lucky Block here. Buy LBLOCK
Note: Cryptosignals.org is not a financial advisor. Do your research before investing your funds in any financial asset or presented product or event. We are not responsible for your investing results.