Battle Infinity Market Forecast: IBAT Is Poised for a Breakout
Estimated Reading Time: 3 minutes
Don’t invest unless you’re prepared to lose all the money you invest. This is a high-risk investment and you are unlikely to be protected if something goes wrong. Take 2 minutes to learn more

Free Crypto Signals Channel
Battle Infinity Market Forecast – September 9
Battle Infinity market forecast is for the price to complete its process of consolidation and breakout out of the current descending triangle pattern.
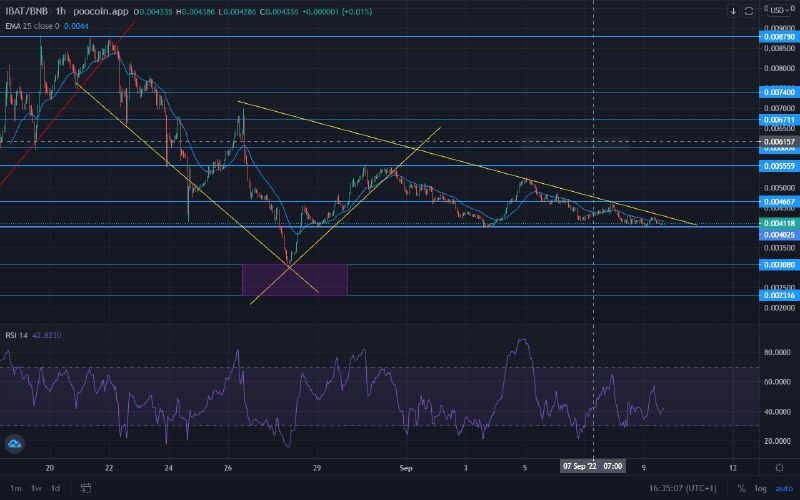
IBAT/USD Long-Term Trend: Bullish (1-Hour Chart)
Key Levels:
Supply Zones: $0.0055590, $0.0087900
Demand Zones: $0.0040250, $0.0030800
Battle Infinity is currently in a tapering movement, in a descending triangle pattern. The more time it takes for the market to remain in the system, the higher it is likely the price will reach the point where it will finally surge upward. The tapering movement of the coin is characterized by a consistent low and a continuous lower high for the candlesticks.
Battle Infinity Market Forecast: IBAT Is Strongly Bullish
The price followed a direct uptrend after bouncing off the significant support level at $0.0030800. However, the strength of that rally was weakened at the $0.0055590 resistance level.
Afterwards, the coin then embarked on a lateral movement to prevent a significant price drop. The $0.0040250 demand level acts as a cushion for the market from below. But as the market traded, more strain was placed on it.
This resulted in a tapering of the price to a triangle pattern. This will lead to an upward breakout of the market. The RSI (Relative Strength Index) is due for an imminent rise after being pressed close to oversold.
IBAT/USD Medium-Term Trend: Bullish (15-minute chart)
The EMA (Exponential Moving Average) period 25 on the 15-minute chart is undulating along with the candlesticks, and it is neither presenting a hindrance nor support to the market. This shows the level of fluidity in the market as it crams into the descending triangle pattern.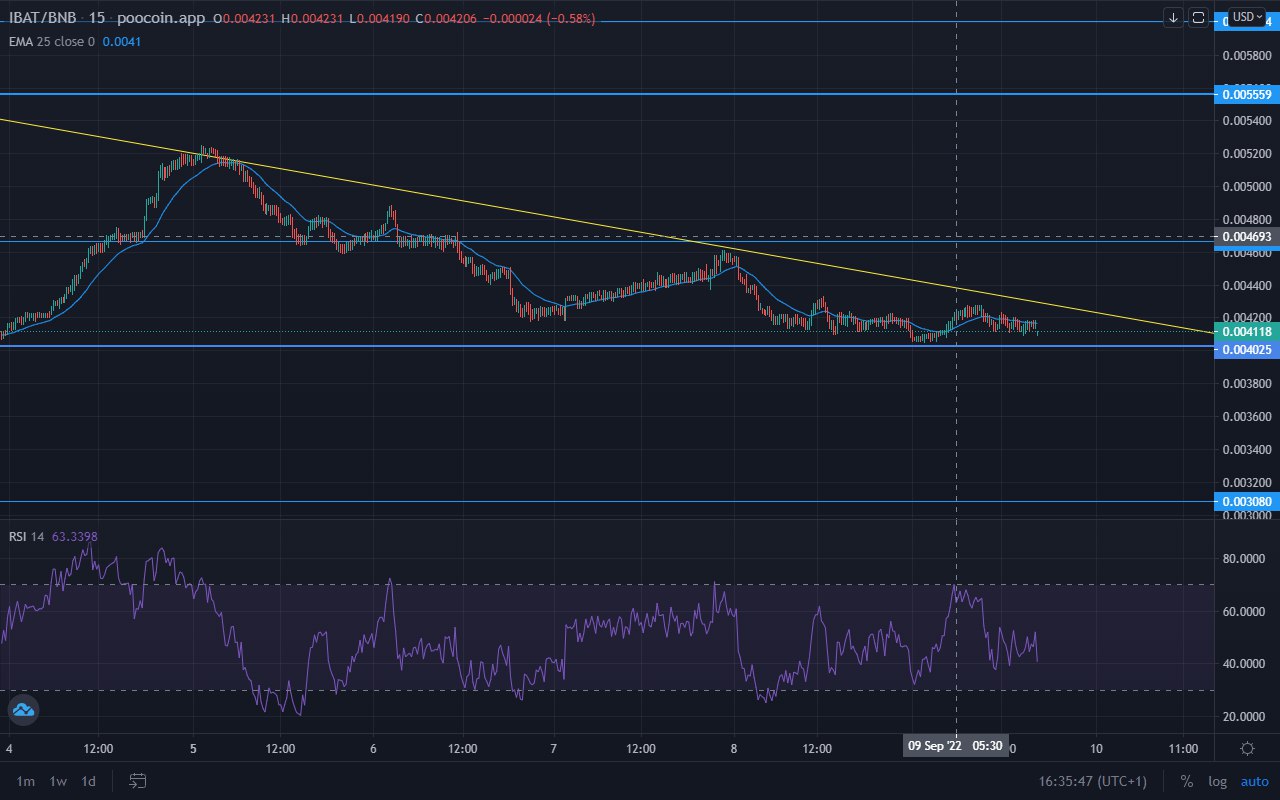
The 5-minute RSI is in the same position as the 30-minute RSI, being pressed close to the oversold border. Battle Infinity is expected to break to the upside of the triangle, defying the $0.555900 resistance level in the process. Then the price will be free to ride through other key levels towards the $0.0087900 supply line.
Battle Infinity has huge potential for unusually massive returns. Buy IBAT
Note: Cryptosignals.org is not a financial advisor. Do your research before investing your funds in any financial asset or presented product or event. We are not responsible for your investing results.