Binance Coin (BNB) is in a sideways move, battles the $600 overhead resistance
Estimated Reading Time: 2 minutes
Don’t invest unless you’re prepared to lose all the money you invest. This is a high-risk investment and you are unlikely to be protected if something goes wrong. Take 2 minutes to learn more

Binance Coin (BNB) Long-Term Analysis: Ranging
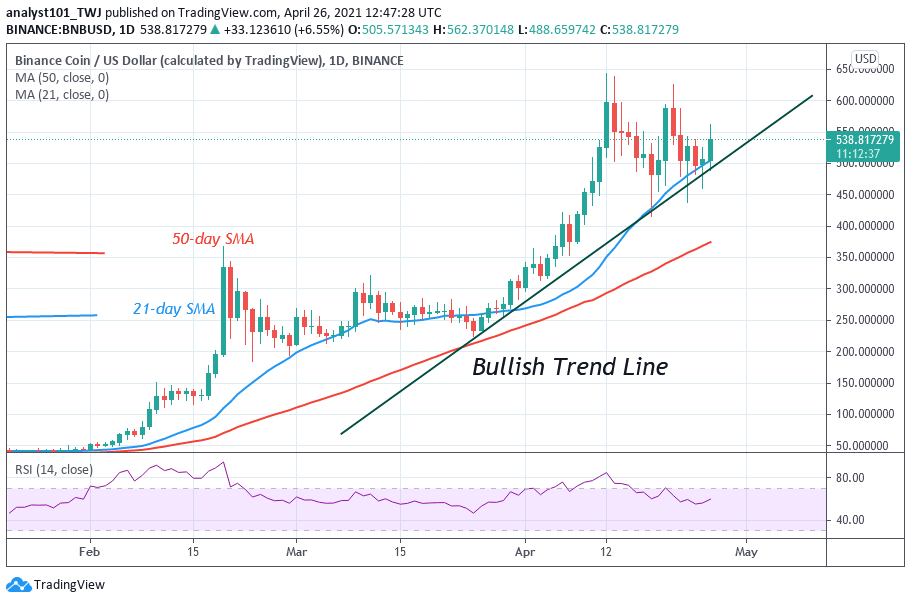
Binance Coin price is range-bound below $600 overhead resistance. Buyers have attempted to break the overhead resistance on April 12 and 20 but were repelled led. The altcoin fell to the low of $480 and resume a range-bound move below the overhead resistance. Today, buyers are pushing the crypto upward to retest the overhead resistance. On the upside, if the bulls break the Overhead resistance, the market will rally to $900. Conversely, if the coin turns down from the recent high, BNB will fall.
Binance Coin (BNB) Indicator Analysis
BNB is at level 60 of the Relative Strength Index period 14. It indicates that the altcoin is in the uptrend zone and capable of rising on the upside. The 21-day SMA and 50-day SMA are sloping upward indicating the uptrend. However, if the crypto’s price breaks below the trend line, BNB will resume a downward move.
Technical indicators:
Major Resistance Levels – $640, $660, $680
Major Support Levels – $540, $520, $500
What Is the Next Direction for Binance Coin (BNB)?
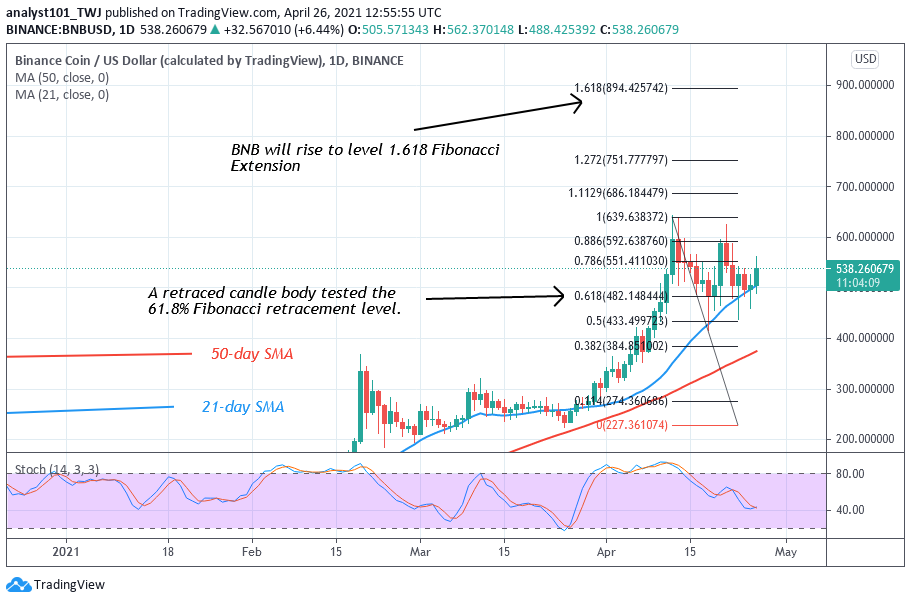
Today, BNB is rising and has broken above the 21-day SMA which suggests the rise of the coin. BNB is likely to face resistance at $600 high. On April 12 uptrend, a retraced candle body tested the 61.8 Fibonacci retracement level. The retracement gives the impression that the market will rise to level 1.618 Fibonacci extension or the high of $894.42.
Note: cryptosignals.org is not a financial advisor. Do your research before investing your funds in any financial asset or presented product or event. We are not responsible for your investing results