Binance Coin (BNB) Regains Bullish Momentum, Battles Resistance at $330
Estimated Reading Time: 2 minutes
Don’t invest unless you’re prepared to lose all the money you invest. This is a high-risk investment and you are unlikely to be protected if something goes wrong. Take 2 minutes to learn more

Binance Coin (BNB) Long-Term Analysis: Bearish
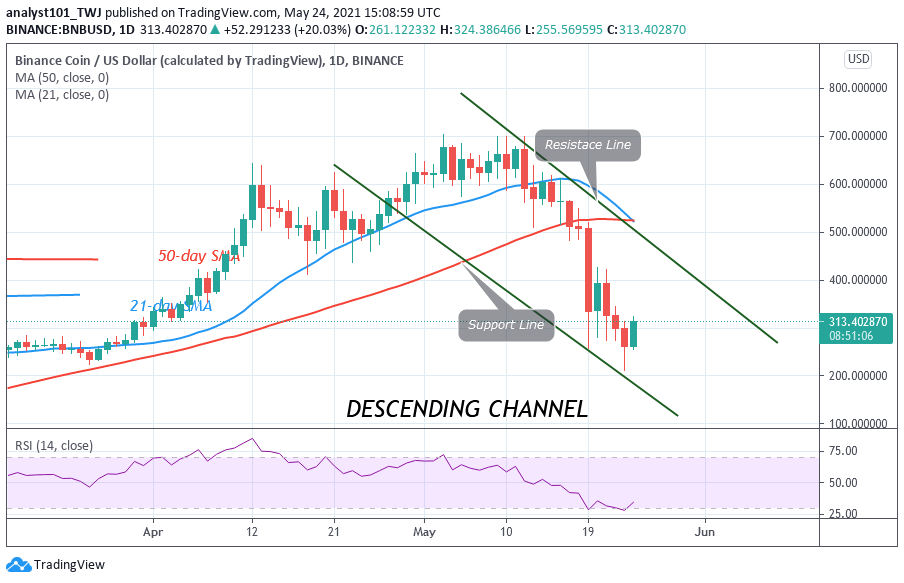
Binance Coin has fallen to $220 low and resumed upward move immediately. The altcoin has risen and it is approaching the high of $330. The upward movement will continue if buyers break the resistance at $330. A rally to $400 is expected. In previous price action, BNB was resisted at the high of $330. The altcoin fell to $220 low and resumed upward. On the upside, if buyers fail to break the initial resistance, BNB/USD will be range-bound between $220 and $330 for a few more days.
Binance Coin (BNB) Indicator Analysis
The crypto’s price is below the 21-day SMA and the 50-day SMA which indicate that the market is still in the bearish trend zone. BNB is prone to further downward movement. The moving averages are at the point of having a bearish crossover. BNB is at level 35 of the Relative Strength Index period 14. It indicates that the altcoin is approaching the oversold region.

Technical indicators:
Major Resistance Levels – $640, $660, $680
Major Support Levels – $540, $520, $500
What Is the Next Direction for Binance Coin (BNB)?
Binance Coin has resumed upward move as price found support above $220.The uptrend will resume if the current support holds. Meanwhile, on May 5 downtrend; a retraced candle body tested the 23.6% Fibonacci retracement level. The retracement indicates that the market will fall to level 4.236 Fibonacci extension or the low of $155.02. From the price action, BNB fell to $220 low and resumed upward. It appears the selling pressure has subsided.

Note: new.cryptosignals.org is not a financial advisor. Do your research before investing your funds in any financial asset or presented product or event. We are not responsible for your investing results