Binance Coin Continues Its Bearish Run, May Decline to $289 Low
Estimated Reading Time: 2 minutes
Don’t invest unless you’re prepared to lose all the money you invest. This is a high-risk investment and you are unlikely to be protected if something goes wrong. Take 2 minutes to learn more

Binance Coin (BNB) Long-Term Analysis: Bearish
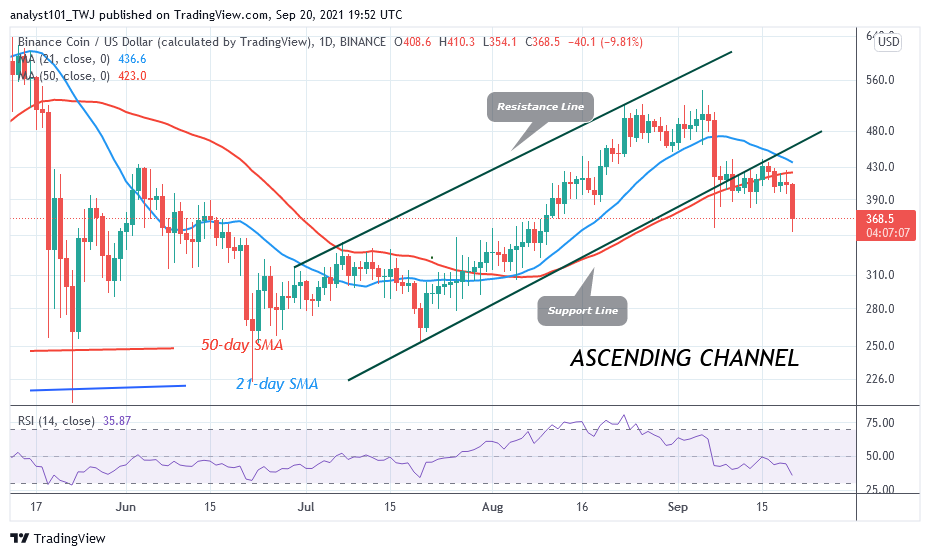
Binance Coin (BNB) has continued to fall down after the recent breakdown. Before the recent price fall, the coin has been consolidating between the moving averages. The selling pressure is likely to continue as price breaks below moving averages. The market has fallen and it retesting the previous price level of June. The altcoin will further decline if the bears break the support at $368. The market will decline to the lows of either $290 or $265.
Binance Coin (BNB) Indicator Analysis
The crypto’s price is below the moving averages which indicates that the selling pressure has resumed. Also, Binance Coin is at level 35 of the Relative Strength Index period 14. It indicates that the coin is in the bearish trend zone and it is approaching the oversold region. BNB is above the 25% range of the daily stochastic. It indicates that the market is in a bullish momentum.
Technical indicators:
Major Resistance Levels – $640, $660, $680
Major Support Levels – $540, $520, $500
What Is the Next Direction for Binance Coin (BNB)?
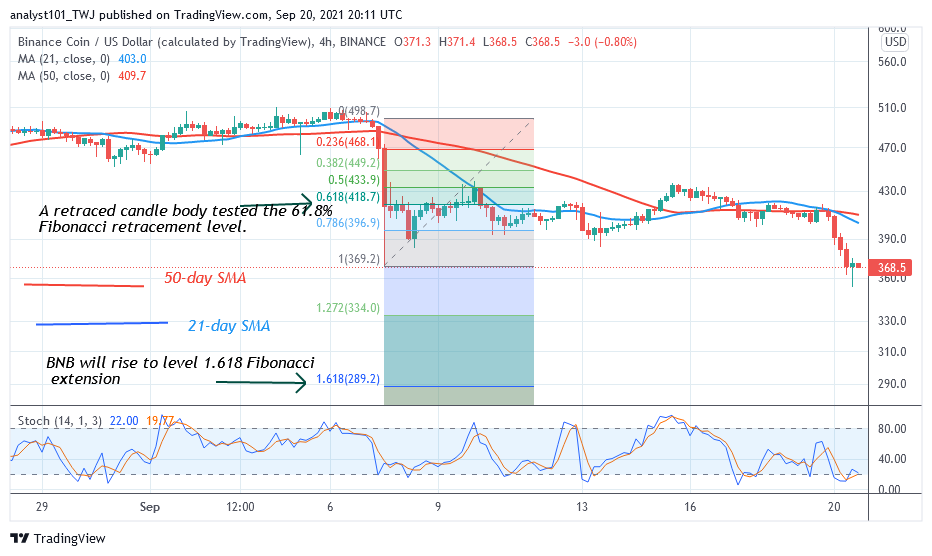
On the 4 –hour chart, the altcoin is in a downward move. The crypto has been consolidating above $390 before the recent breakdown. Meanwhile, on September 2 downtrend; a retraced candle body tested the 61.8% Fibonacci retracement level. The retracement indicates that the coin will fall to level 1.618 Fibonacci extension or level $289.20.
You can purchase crypto coins here. Buy Tokens
Note: Cryptosignals.org is not a financial advisor. Do your research before investing your funds in any financial asset or presented product or event. We are not responsible for your investing results