Binance Coin Declines as It Targets the Previous Low of $300
Estimated Reading Time: 3 minutes
Don’t invest unless you’re prepared to lose all the money you invest. This is a high-risk investment and you are unlikely to be protected if something goes wrong. Take 2 minutes to learn more
Binance Coin (BNB) Long-Term Analysis: Bullish
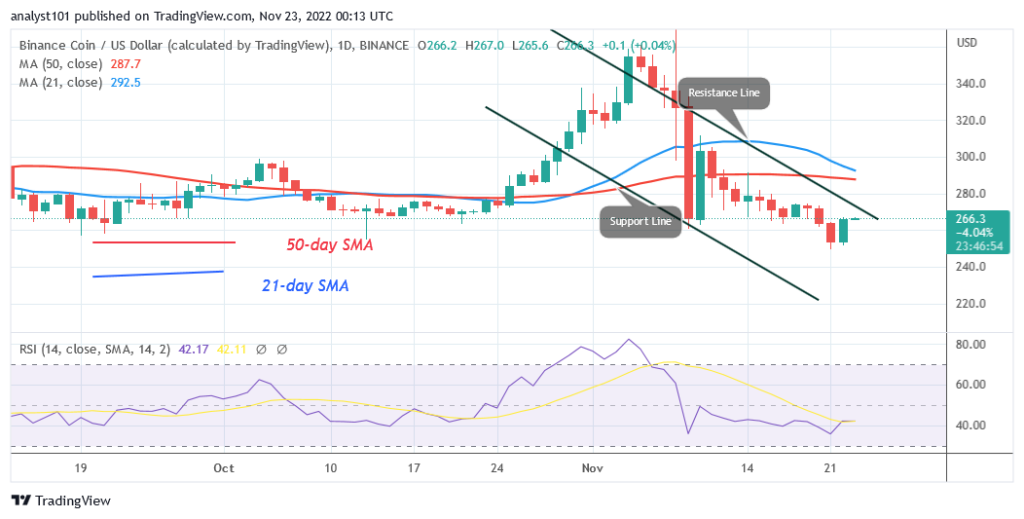
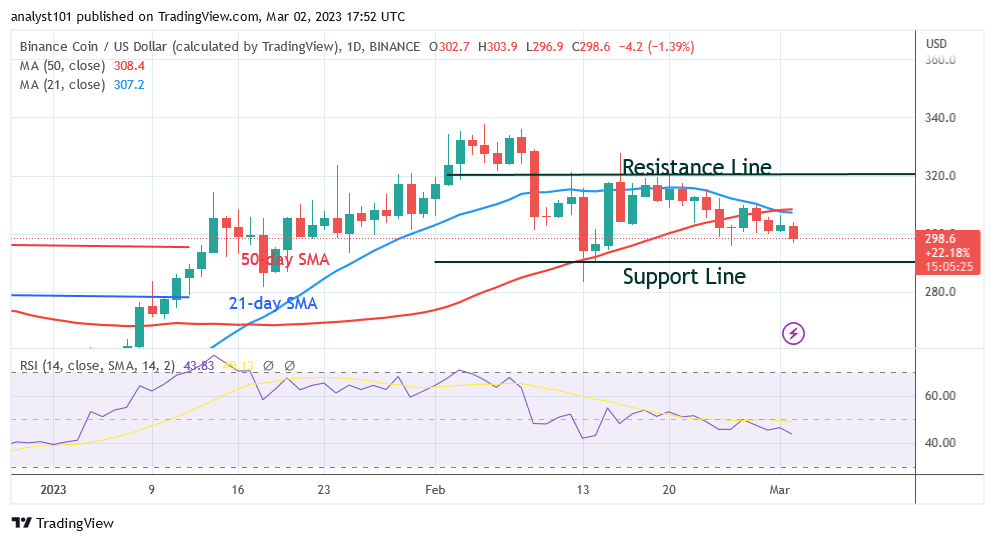
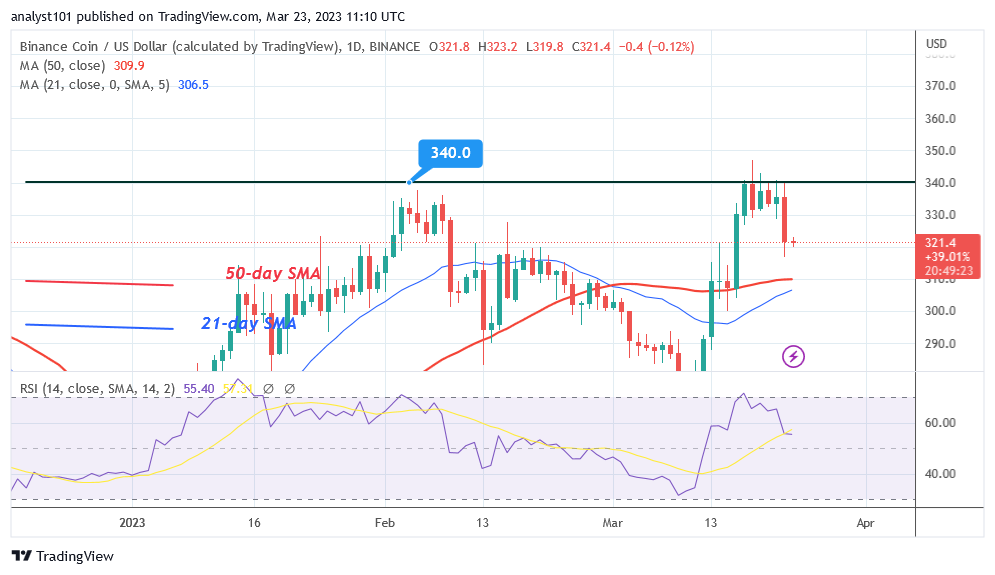
Binance Coin (BNB) loses value after being rejected at its $340 peak as it targets the previous low of $300. The altcoin reached a high of $360 in November 2022 before being rejected. BNB is currently trading for $321.30 as of this writing. Selling pressure is likely to continue until the price reaches the low above the moving average lines. The market will resume its previous trend if BNB declines more than the moving average lines. A low of $300 will be reached by the altcoin if the price falls below the moving average lines. During this time, the altcoin has reached an oversold market condition. The selling pressure will probably ease.
Technical indicators:
Major Resistance Levels – $440, $460, $480
Major Support Levels – $240, $220, $200
Binance Coin (BNB) Indicator Analysis
BNB is at level 55 for period 14 of the Relative Strength Index. The altcoin is still in the bullish trend zone despite its recent decline. If BNB maintains its position above the moving average lines, the bullish trend might resume. BNB will continue to rise as long as the price bars are higher than the moving average lines. The oversold area of the market is where the altcoin has fallen. When the market dips below the daily Stochastic’s level 20, it indicates bearish exhaustion.
What Is the Next Direction for Binance Coin (BNB)?
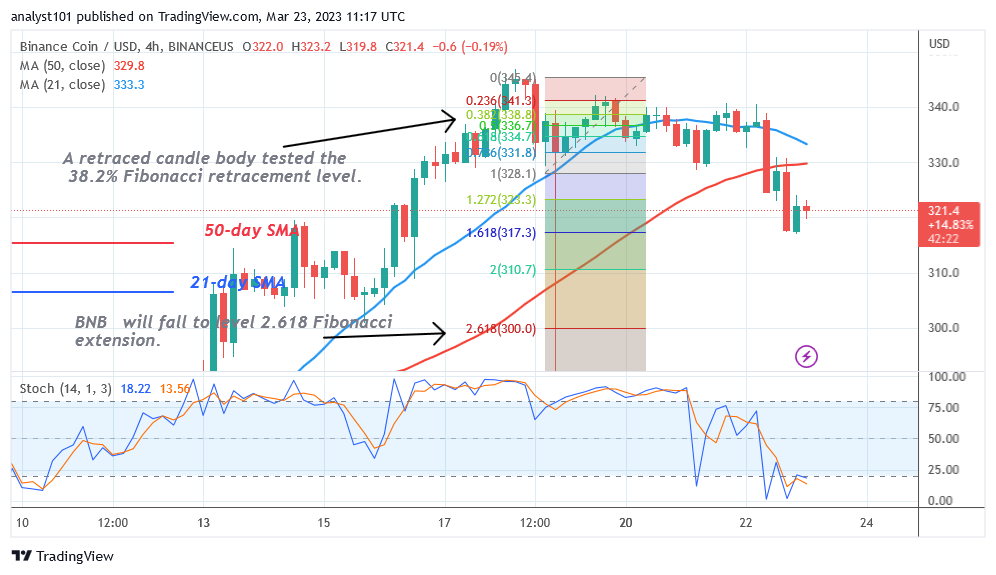
Binance Coin has fallen in the oversold region of the market as it targets the previous low of $300. The price indicator has indicated that there will be more decline. Following the downtrend that began on March 18, BNB made an upward correction, and a retraced candle body tested the 38.2% Fibonacci retracement level. The correction predicts that BNB will fall to $300, or the level of the 2.618 Fibonacci extension.
You can purchase crypto coins here. Buy LBLOCK
Note: Cryptosignals.org is not a financial advisor. Do your research before investing your funds in any financial asset or presented product or event. We are not responsible for your