Binance Coin Is Stuck Below $580 High, Resumes Sideways Move
Estimated Reading Time: 2 minutes
Don’t invest unless you’re prepared to lose all the money you invest. This is a high-risk investment and you are unlikely to be protected if something goes wrong. Take 2 minutes to learn more
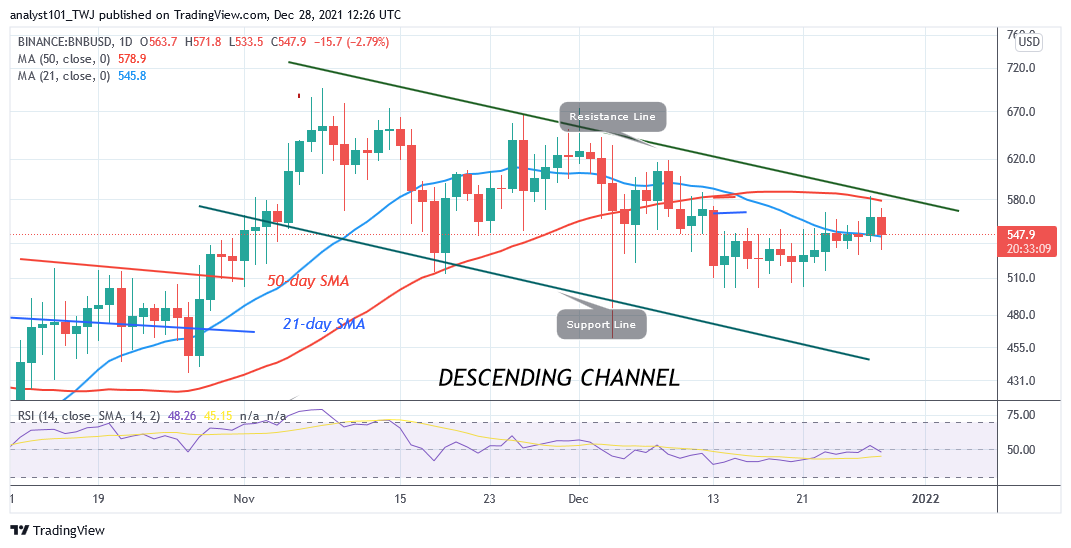

Binance Coin (BNB) Long-Term Analysis: Bearish
Binance Coin’s (BNB) price is still in a downward correction as it resumes sideways move. BNB price is above the 21-day SMA but below the 50-day SMA. BNB will resume an upward move if price breaks above the 50-day moving average. In the same vein, if price breaks below the 21-day moving average, the cryptocurrency will further decline to the downside. Nevertheless, where the two moving averages remain unbroken, the altcoin will continue to be range-bound between the moving averages.
Binance Coin (BNB) Indicator Analysis
BNB has risen to level 48 of the Relative Strength Index for period 14. It indicates that the altcoin is in the downtrend zone and below the centerline 50. BNB is below the 50% range of the daily stochastic. The market has been in a bearish momentum after rejection from the $570 high.
Technical indicators:
Major Resistance Levels – $640, $660, $680
Major Support Levels – $540, $520, $500
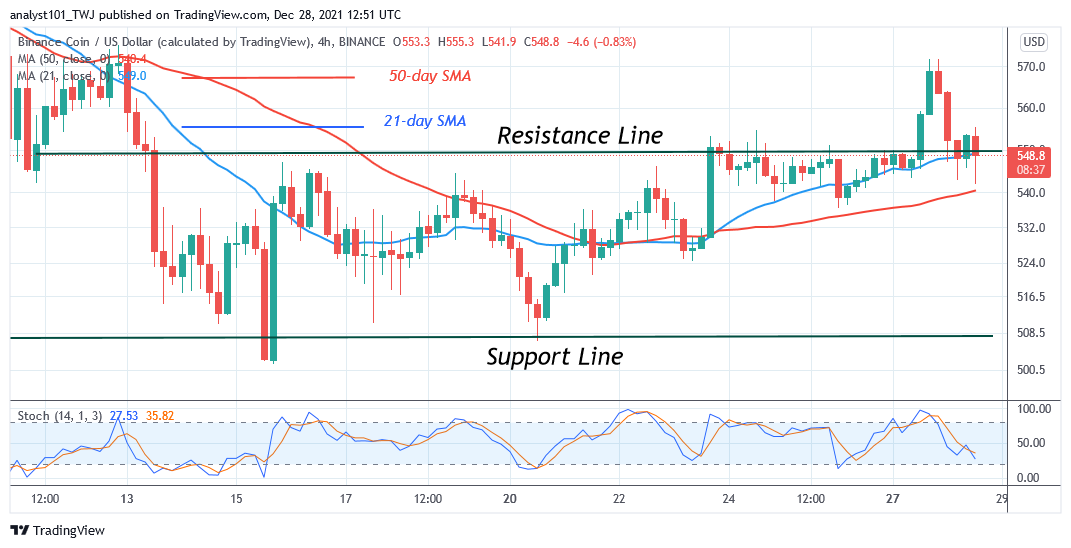
What Is the Next Direction for Binance Coin (BNB)?
On the 4 hour chart, BNB/USD holds above $510 as it resumes sideways move. The altcoin has been trading in a confined range. It is fluctuating between $508 and $550 price levels. The altcoin will trend when the range-bound levels are breached and the momentum is sustained.
You can purchase crypto coins here. Buy Tokens
Note: Cryptosignals.org is not a financial advisor. Do your research before investing your funds in any financial asset or presented product or event. We are not responsible for your investing results