BNB’s Downtrend Is Stuck above $220 as It Remains Stagnant
Estimated Reading Time: 2 minutes
Don’t invest unless you’re prepared to lose all the money you invest. This is a high-risk investment and you are unlikely to be protected if something goes wrong. Take 2 minutes to learn more
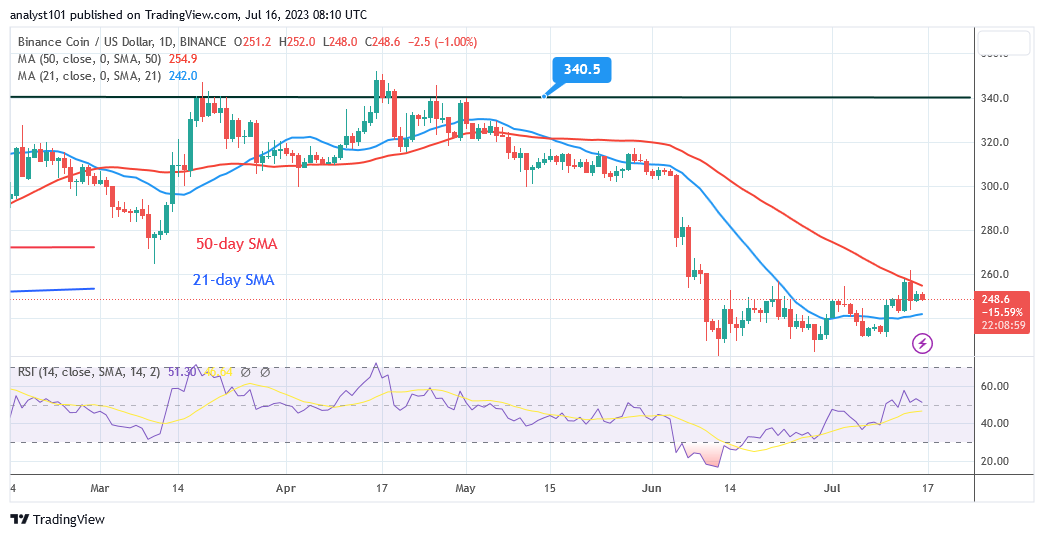
BNB (BNB) Long-Term Analysis: Bearish
BNB (BNB) has been trading at the bottom of the chart since June 12 as it remains stagnant. The bearish momentum has ceased as the price has hit the historical level of December 15, 2022. The cryptocurrency is trading between $220 and $260. The moving average lines have trapped the price bars.
The crypto asset has been compelled to a range bond move, preventing it from resuming a positive trend. On the upside, the bullish momentum has been stifled by resistance near $260 and the 50-day simple moving average. If the current resistance levels are breached, BNB will surge to a high of $320.
On the downside, the market has attained bearish exhaustion as it remains above the historical price level of December 15, 2022.
Technical indicators:
Major Resistance Levels – $440, $460, $480
Major Support Levels – $240, $220, $200
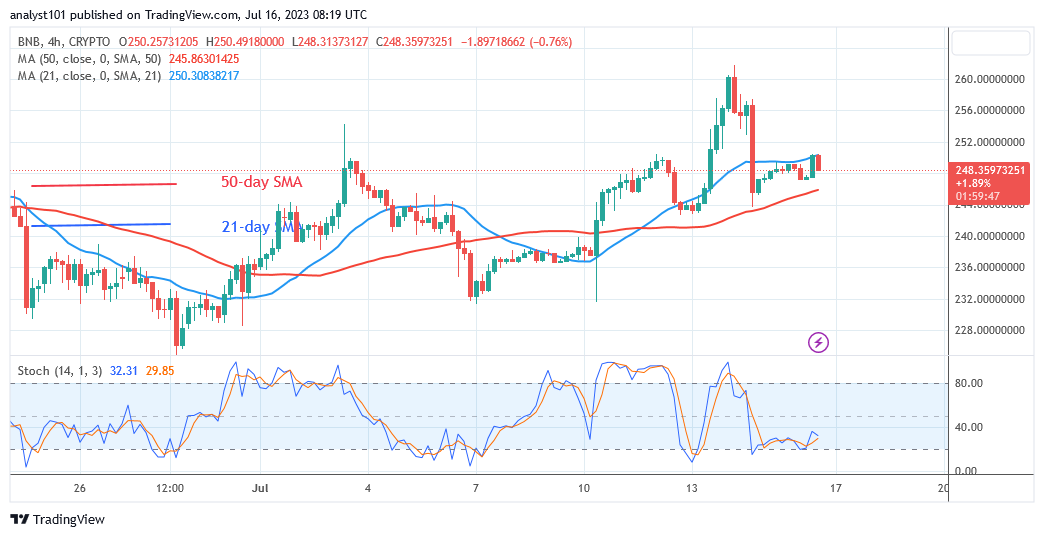
Binance Coin (BNB) Indicator Analysis
BNB is currently caught between the moving average lines, indicating that the currency will be forced to make a range-bound move. The cryptocurrency’s price is now at Relative Strength Index level 51 for period 14. It shows that BNB has attained the equilibrium price level, which occurs when demand and supply are balanced. The bearish momentum has stalled below the daily Stochastic level of 40.
What Is the Next Direction for Binance Coin (BNB)?
For the previous month, the cryptocurrency has been moving sideways as it remains stagnant. As the cryptocurrency trades between $220 and $260, neither buyers nor sellers have the upper hand. If the resistance levels are breached, the altcoin will resume its bullish trajectory.
You can purchase crypto coins here. Buy LBLOCK
Note: Cryptosignals.org is not a financial advisor. Do your research before investing your funds in any financial asset or presented product or event. We are not responsible for your investing results