BNB’s Price Fluctuates as It Remains above Its $290 Low
Estimated Reading Time: 2 minutes
Don’t invest unless you’re prepared to lose all the money you invest. This is a high-risk investment and you are unlikely to be protected if something goes wrong. Take 2 minutes to learn more

BNB (BNB) Long-Term Analysis: Bearish
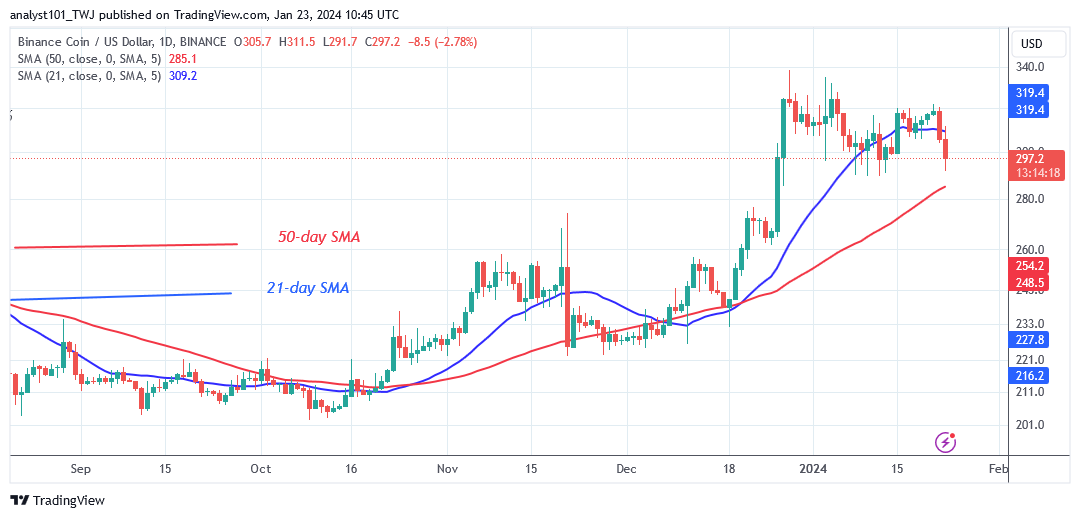
BNB’s price has dropped below the 21-day SMA as it remains above its $290 low. BNB will continue to fall if the bearish momentum persists. First, it will fall above the 50-day SMA, or $280 low. Nonetheless, the altcoin will resume its range-bound movement between $280 and $340, with BNB holding above the 50-day SMA.
If the price falls below the moving average lines, BNB will continue its downward trend. The altcoin’s price will fall further, reaching a low of $260. Meanwhile, BNB/USD is caught between the moving average lines. It is rebounding as it retests the existing support level of $290.
Technical indicators:
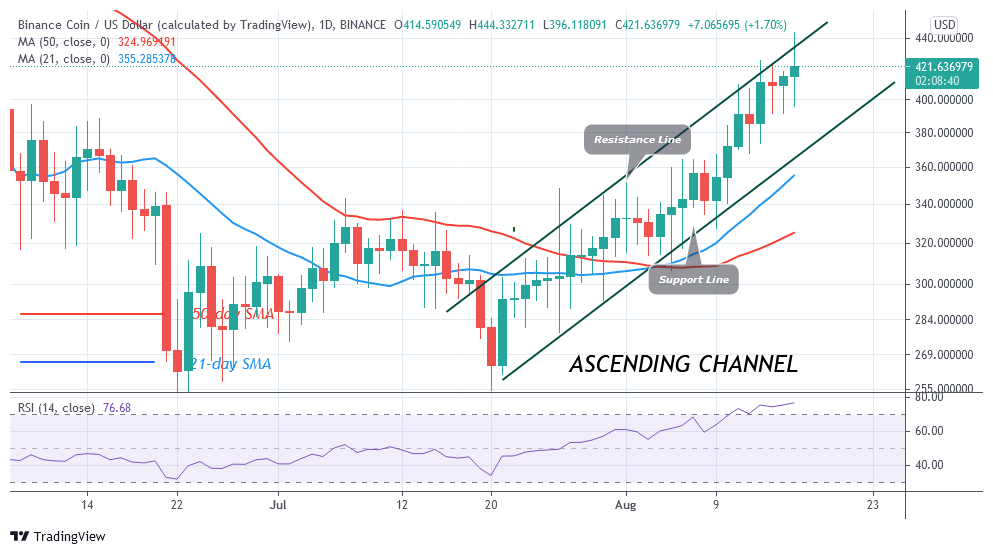
Major Resistance Levels – $440, $460, $480
Major Support Levels – $240, $220, $200
BNB (BNB) Indicator Analysis
Following its recent decrease, the price bars are now aligned with the moving average lines. The cryptocurrency is expected to trade between the moving average lines for a few days. On the 4-hour chart, the price bars are located below the horizontal moving average lines.
What Is the Next Direction for BNB (BNB)?
BNB/USD slide subsides as it remains above its $290 low. Since the January 3 price drop, the market has remained above the $290 support. There will be more selling pressure if this support level is breached. The altcoin will resume varying between the moving average lines if the current support holds. BNB will restart its upward trend when buyers sustain the price above the moving average lines.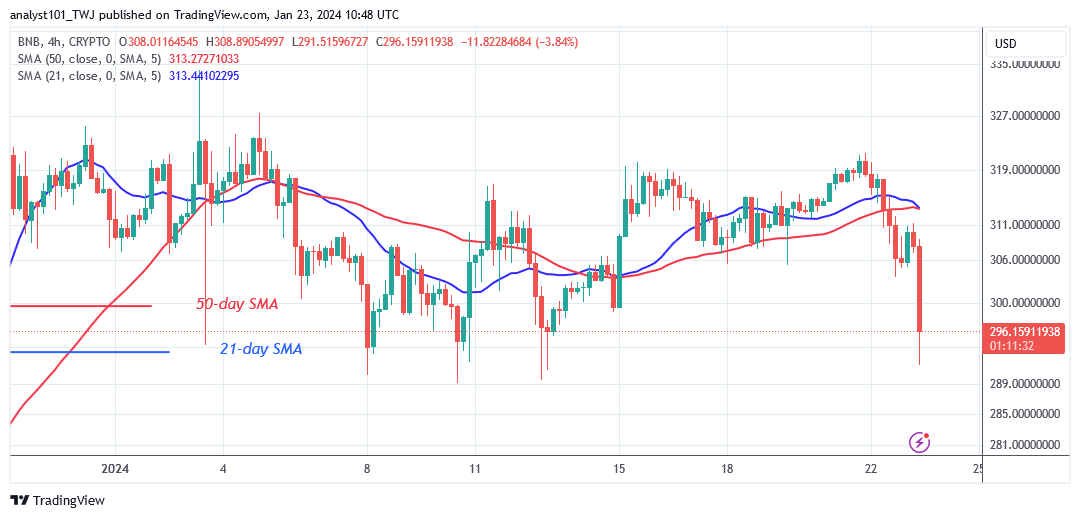
You can purchase crypto coins here. Buy LBLOCK
Note: Cryptosignals.org is not a financial advisor. Do your research before investing your funds in any financial asset or presented product or event. We are not responsible for your investing results