BNB’s Price Varies In A Range After Its Rejection At $720
Don’t invest unless you’re prepared to lose all the money you invest. This is a high-risk investment and you are unlikely to be protected if something goes wrong. Take 2 minutes to learn more

BNB (BNB) Long-Term Analysis: Bullish
The BNB price is retracing above the moving average after its rejection at $720. On June 3, the crypto rebounded and broke through the overhead resistance at $635. The altcoin reached a high of $725 before being repulsed. BNB has returned to its prior pricing range of $560-$635. The altcoin has dropped to a low of $644. According to the price prediction, BNB will fall to a low of $608.
Currently, the cryptocurrency’s price is above the 21-day moving average lines. The upward trend will resume if the 21-day SMA support is maintained. BNB will rise to its prior high of $725. On the other hand, BNB/USD will vary between the 21-day SMA support and the $720 high resistance.
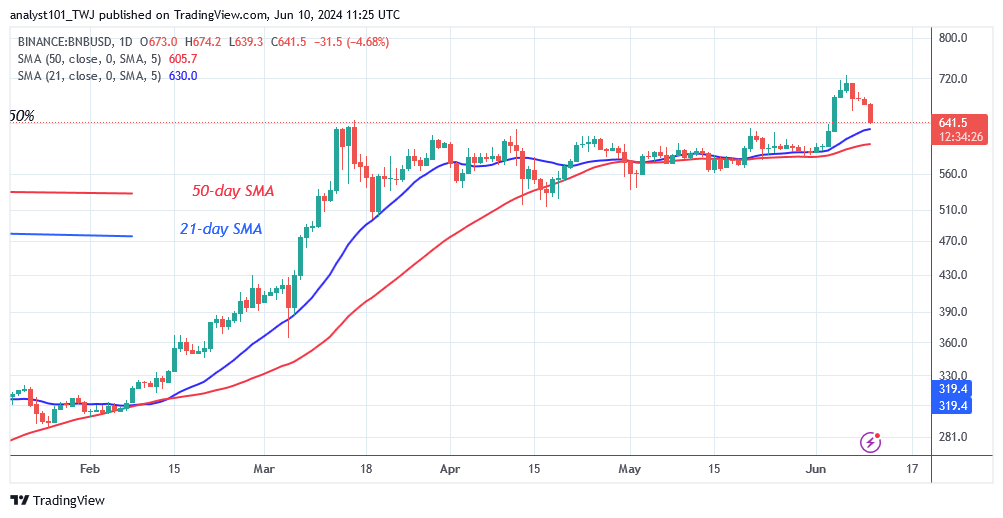
Technical indicators:
Major Resistance Levels – $600, $660, $720
Major Support Levels – $400, $340, $280
BNB (BNB) Indicator Analysis
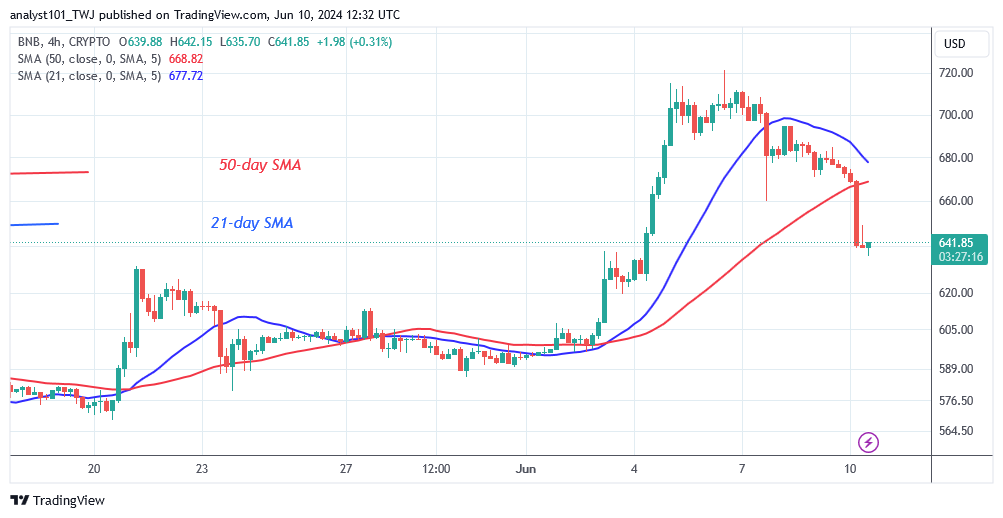
The price bars remain above the horizontal moving average lines following the latest retracement. The moving average lines on the 4-hour chart are sloping upward, despite the fall. The 21-day moving average lines are trending downward, signaling a fall.
What Is the Next Direction for BNB (BNB)?
On the 4-hour chart, Binance Coin is declining below the moving average lines after its rejection at $720. The cryptocurrency asset was earlier on an upswing, reaching a high of $725. BNB largely recovered from the previous downturn but failed to maintain its current high. The altcoin dropped after two rejections at its recent peak.
On the negative, the crypto asset will fall to a low of $608. The crypto signal will be negative if it fails to hold above the 21-day SMA.
You can purchase Lucky Block here. Buy LBLOCK
Note: Cryptosignals.org is not a financial advisor. Do your research before investing your funds in any financial asset or presented product or event. We are not responsible for your investing results