Bitcoin Cash (BCH/USD) Converges Heavily at Lower Range
Estimated Reading Time: 3 minutes
Don’t invest unless you’re prepared to lose all the money you invest. This is a high-risk investment and you are unlikely to be protected if something goes wrong. Take 2 minutes to learn more
Bitcoin Cash Price Prediction – June 11
The market worth of BCH/USD now converges heavily at a lower range-line of $600. Before the present closely observed trading situation, the crypto embarked on a serial lowering of values around the ranges of $800 and the earlier mentioned value. Price now trades around $605 at a rate of 0.70% increment.
BCH/USD Market
Key Levels:
Resistance levels: $800, $1,000, $1,200
Support levels: $500, $400, $300
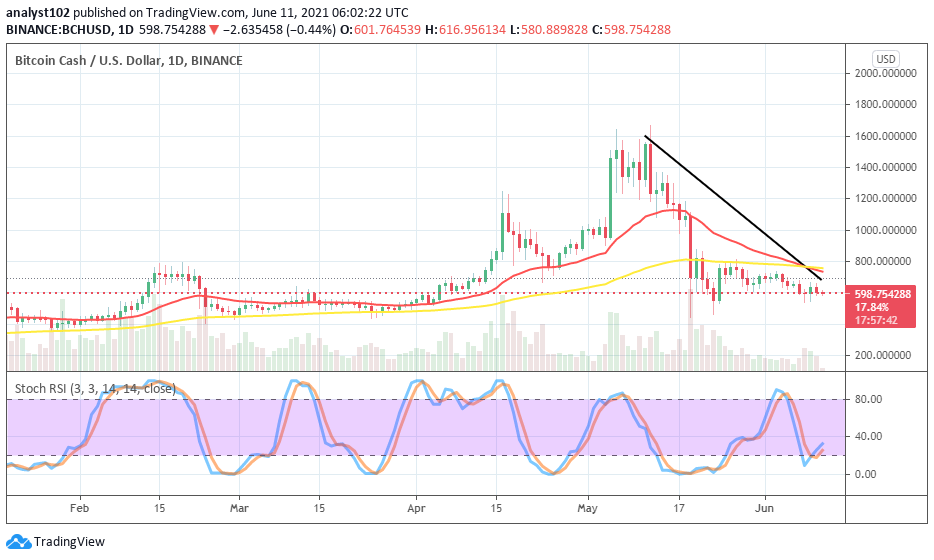
BCH/USD – Daily Chart
Since June 7th day’s trading session has led to touching the lower range-line, the BCH/BTC market now converges heavily at the point until the present. The 50-day SMA has been strongly intercepted from the top by the 14-day SMA trend-line lightly to the south as the bearish trend-line drew across them downward to locate a resistance close above the current trading zone of the market. The Stochastic Oscillators have quickly from the oversold region to point northbound close underneath range 40 to suggest the possibility of getting to see an upside moves in the crypto activities.
Will there soon be an outright breakdown as BCH/USD converges heavily at the lower range line?
Currently, there has been no clear signal suggesting that the BCH/USD’s price converges heavily at the lower range-line will be broken down in the near session. The crypto appears looking for strong support as well around the lower trading zone. In the meantime, the present state of the market operations could be considered worthy of buying into by an intending investor. Almost in the vein, long-taking traders could launch their positions now around the lower range trading spot.
Looking closely at the technical trading approach of this crypto market bears now needed to hold their stances stronger against any eventual rebound that is seemingly hiding around the lower range trading area. An outright interception of the 50-day SMA indicator by the 14-day SMA trend-line will most likely put bears on a brighter outlook of profiteering possibly for a while. Therefore, a trader going alongside with a downward move after a presumed breakdown of the lower range-line could witness bears’ trap in no time.
BCH/BTC Price Analysis
Comparing the moving weight between Bitcoin Cash and Bitcoin, the daily price analysis chart reveals that the base crypto is on the verge of losing more momentum to the counter crypto as the bigger SMA trend-line has somewhat breached to the south. The bullish trend-line drew also conjoining the 50-day SMA indicator as they placed underneath the 14-day SMA trend-line. The Stochastic Oscillators are in the oversold region attempting to cross the lines. That could be a signal portending continuation of less-active pushes between the cryptos. A crossing of the bigger SMA by the smaller SMA seems not achievable in the near time. As a result, a consolidation moving mood is still on a higher expectation note to continue between the two trading instruments.
Note: new.cryptosignals.org is not a financial advisor. Do your research before investing your funds in any financial asset or presented product or event. We are not responsible for your investing results.