Bitcoin Cash (BCH/USD) Market Holds Positions Between $350 and $300
Estimated Reading Time: 3 minutes
Don’t invest unless you’re prepared to lose all the money you invest. This is a high-risk investment and you are unlikely to be protected if something goes wrong. Take 2 minutes to learn more

Free Crypto Signals Channel
Bitcoin Cash Price Prediction – April 22
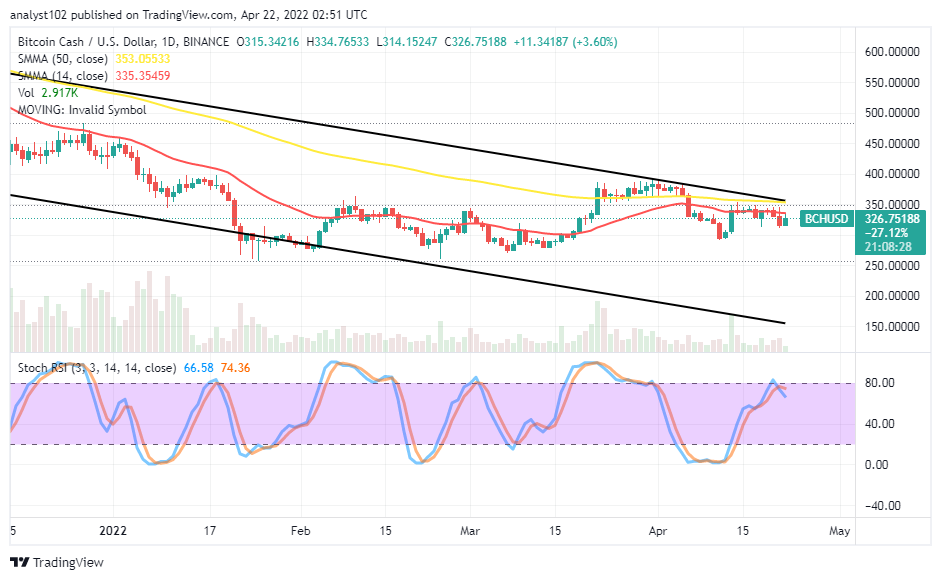
BCH/USD market holds positions between $350 and $300 psychological trading points. The situation may uphold for some time as the crypto-economic price trades at $326 at a positive percentage rate of 3.60.
BCH/USD Market
Key Levels:
Resistance levels: $3500, $400, $450
Support levels: $300, $250, $200
BCH/USD – Daily Chart
The BCH/USD daily chart showcases the crypto-economic market holds positions between $350 and $300 trading levels. The bearish channel trend lines drew to indicate that the crypto economy is still under a downward trend. There is a smaller space between the trading indicators as the 50-day SMA is above the 14-day SMA. The Stochastic Oscillators have briefly crossed their lines southbound at 80 range-line.
Will the BCH/U trade price change the pattern soon as it holds positions between $350 and $300?
A slight change of direction may occur in the long-term run of the BCH/USD business operations if selling forces are intense in the current situation. The crypto-economic market holds positions between $350 and $300 trading levels. Buyers may lack the much-needed catalyst to boost their movement sustainably to stay afloat over the formerly mentioned value-line in the near time.
On the downside of the technical analysis, the BCH/USD market sellers have a higher-potential chance to get a decent sell entry as the crypto economy is finding it difficult to break past the $350 resistant trading level over a couple of sessions. The crossing of the Stochastic Oscillators to the southbound at an 80 range 0 signifies a falling force may occur soon.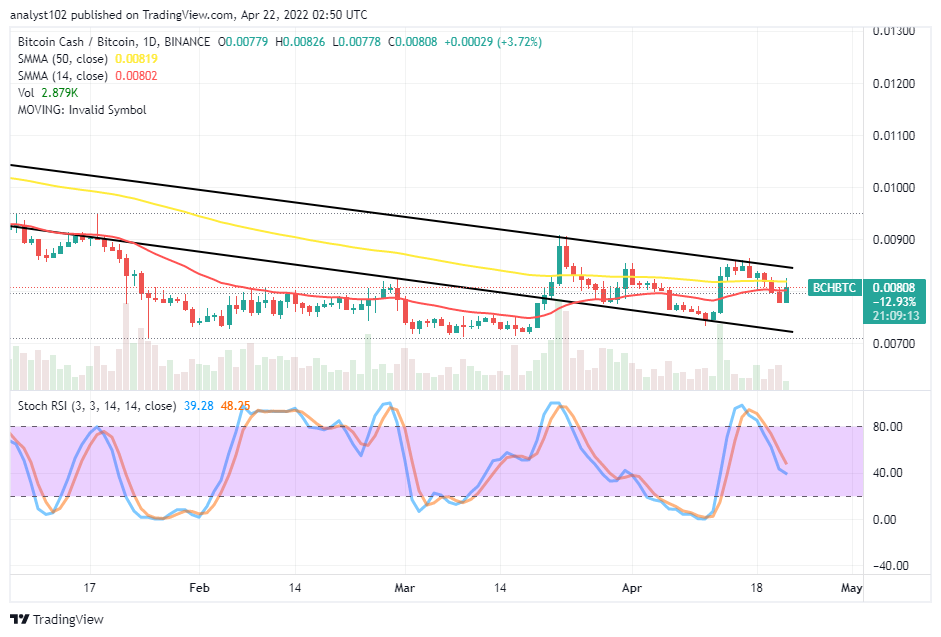
BCH/BTC Price Analysis
In comparison, Bitcoin Cash is currently trying to push for recovery after running into a correction process with Bitcoin about fewer days back. The cryptocurrency pair market holds between bearish channel trend lines drawn to ascertain the trend that the price keeps. The 50-day SMA indicator is closely above the 14-day SMA indicator. The Stochastic Oscillators have crossed southbound from the overbought region. And they are now trying to cross back the lines northbound from the range of 40. With a bullish candlestick currently in the making, the base crypto stands an opportunity to regain a part of its lost momentum as it trades against the countering crypto.
Note: Cryptosignals.org is not a financial advisor. Do your research before investing your funds in any financial asset or presented product or event. We are not responsible for your investing results.
You can purchase Lucky Block here. Buy LBlock: