Bitcoin Cash (BCH/USD) Market Stays Lower in Ranges
Estimated Reading Time: 3 minutes
Don’t invest unless you’re prepared to lose all the money you invest. This is a high-risk investment and you are unlikely to be protected if something goes wrong. Take 2 minutes to learn more
Bitcoin Cash Price Prediction – July 16
The BCH/USD market stays lower in ranges close to $400 to trade around the value of $455. The crypto trade records a percentage rate of about -0.10.
BCH/USD Market
Key Levels:
Resistance levels: $600, $800, $1,000
Support levels: $400, $300, $200
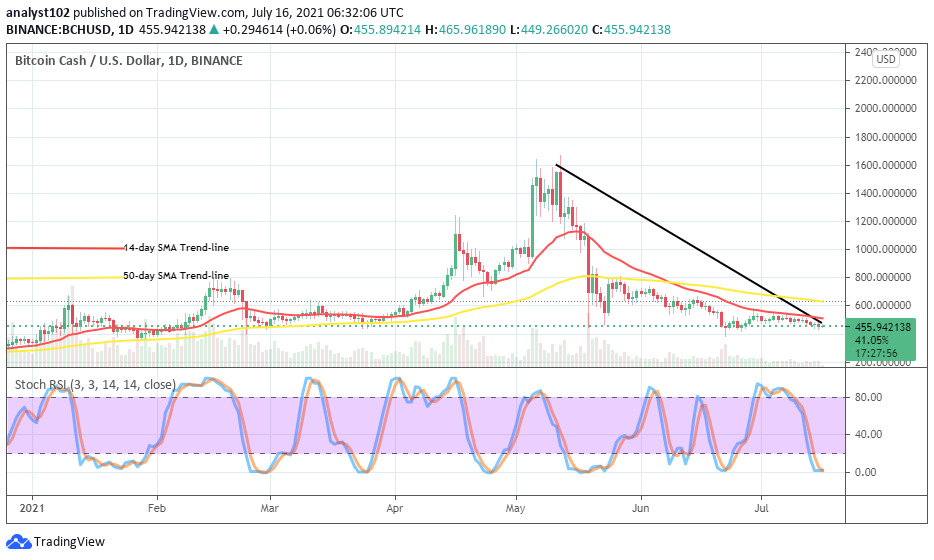
BCH/USD – Daily Chart
It is featured on the BCH/USD daily chart that the crypto market stays lower in ranges of $600 and $400. A line of variant smaller-lows is formed close to the lower range-line over a couple of sessions. The 50-day SMA trend-line is above the 14-day SMA trend-line as the bearish trend-line drew downward across them to mark down the point at which the lower lows of the crypto feature. The Stochastic Oscillators are in the overbought region, suggesting the crypto is seemingly preparing the stance against the US Dollar’s market valuation.
Will BCH/USD take more time to change from its current trend as the crypto market stays lower in ranges?
The BCH/USD bulls are likely to hold on to their coming back until a while. Being as it is, the crypto market stays lower in ranges. Price is most likely to push continually lowering around the lower range point at $400 while bulls may use the situation to muster up the energy. The moment that a bullish candlestick appears at a low-trading spot may project a start of an upward trend returning in the crypto economy.
Analyzing the continuity of the downside of this crypto market, the strength of bears shows the sign of weakening, as confirmed by the reading of the Stochastic Oscillators. Some downward forces that feature now in the market could be dense for a while. However, a sudden resurfacing of a spike around the range-bound trading zones may potentially portend a return of an upswing in the market.
BCH/BTC Price Analysis
A line of smaller-ups and smaller-downs is currently ongoing between Bitcoin Cash and Bitcoin, as depicted on the price analysis chart. The base crypto stays lower in ranges as paired with the counter crypto close beneath the trend-line of smaller SMA. The 50-day SMA indicator is over the 14-day SMA indicator as they are close, pointing toward the east. The Stochastic Oscillators are in the oversold region with the lines slightly crossed northbound in it. That suggests that the base trading instrument is somewhat warming up for momentum against the flagship counter crypto.
Note: Cryptosignals.org is not a financial advisor. Do your research before investing your funds in any financial asset or presented product or event. We are not responsible for your investing results.
You can purchase crypto coins here. Buy Tokens