Bitcoin Cash (BCH/USD) Market Trades Under Depressions
Estimated Reading Time: 3 minutes
Don’t invest unless you’re prepared to lose all the money you invest. This is a high-risk investment and you are unlikely to be protected if something goes wrong. Take 2 minutes to learn more

Free Crypto Signals Channel
Bitcoin Cash Price Prediction – May 20
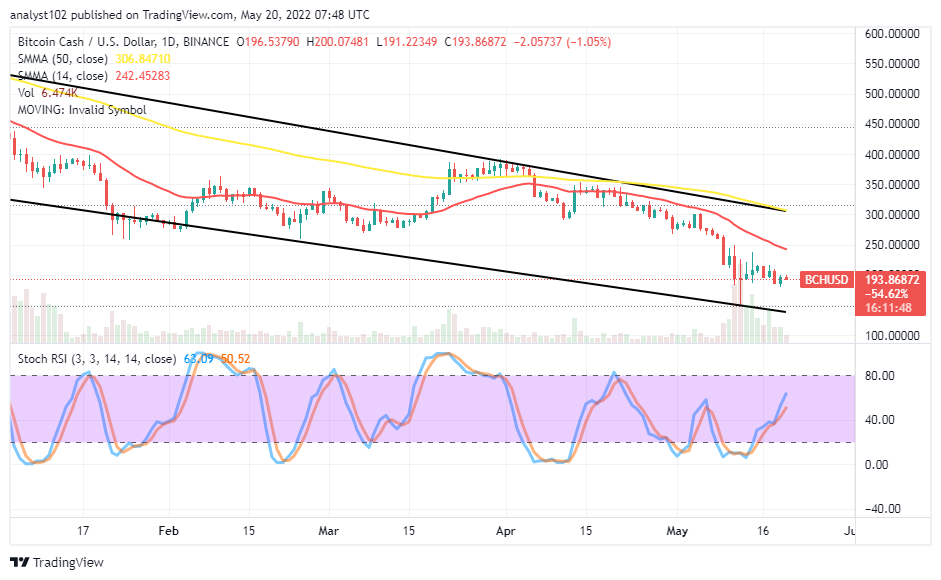
It has consistently observed the BCH/USD market trades under depressions settings for quite a while. Currently, the crypto trade features between $200 and $191 at a negative percentage rate of 1.05.
BCH/USD Market
Key Levels:
Resistance levels: $250, $300, $350
Support levels: $150, $100, $50
BCH/USD – Daily Chart
The BCH/USD daily chart reveals the crypto-economic market trades under a depressions trading pattern. The 14-day SMA indicator has more bent southwardly beneath the 50-day SMA indicator. The bearish channel trend lines enclose the downing motions obtained in the transactions. The Stochastic Oscillators are trying to move upward through the different range lines to showcase the base crypto ought to have pushed for a rebound against its counter crypto. But it is failing in the capability to do so.
Can there be a rebounding force in the BCH/USD market soon?
The gravitational capacity of the BCH/USD market as of writing appears not trying to garner an ideal weight to ensure a long-holding of positions to the upside in the near time. Price needed to come down for a necessary correction from the current trading arena to be able to grab a healthy up stride afterward. Investors may have to exercise the habit of buying and holding while the market dips further to maximize profits when a bullish-trending cycle returns.
On the downside, the BCH/USD market short-position players, at this point, probably have no decent entry to launch a new selling order. They can allow positions that have opened before breaching the $250 value line on the May 9th session to run by trailing profits techniques. Any attempt of price rejection or reversal around the value line can give back into the downside direction.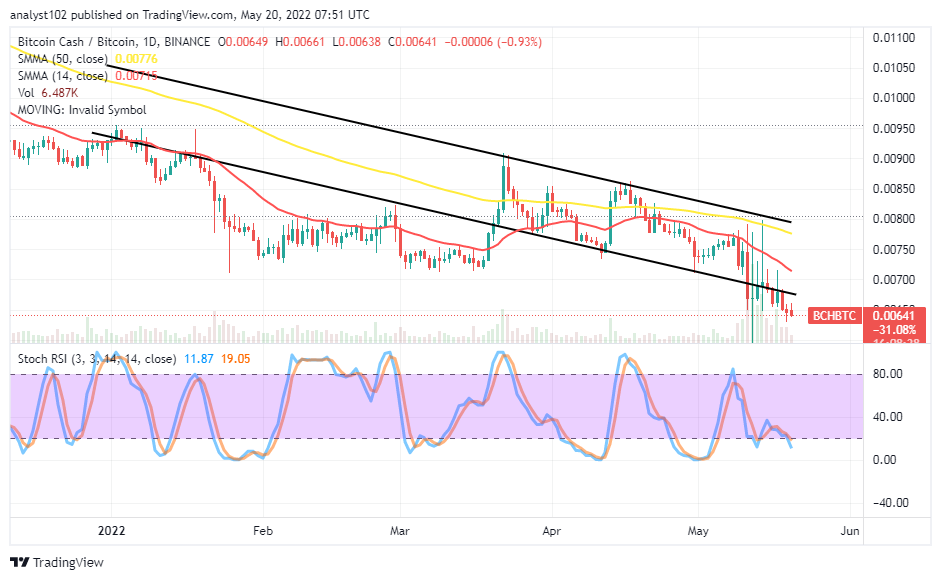 BCH/BTC Price Analysis
Bitcoin Cash market is yet unable to force its strength back upward against the trending ability of Bitcoin, the most valuable crypto-economy until the present. The cryptocurrency pair market trades under depressions settings as the trading SMA indicators are above the variant candlesticks, featuring to give the current trading spot. The 14-day SMA is below the 50-day SMA. The Stochastic Oscillators are attempting to dip into the oversold region. That shows the flagship countering crypto has a prevalent-trending power over the base trading crypto. But, a sudden emergence of a bullish candlestick will serve as a warning signal to getting reliable downs in its following sessions whenever it occurs.
Note: Cryptosignals.org is not a financial advisor. Do your research before investing your funds in any financial asset or presented product or event. We are not responsible for your investing results.
“Lucky is up more than 50% today but still more than 430% from All Time Highs!
The opportunity to bank BIG is now!
You can purchase Lucky Block here. Buy LBlock: