Shiba Inu (SHIBUSD) Heads Lower As Price Breaks Diagonal Support Downward
Estimated Reading Time: 2 minutes
Don’t invest unless you’re prepared to lose all the money you invest. This is a high-risk investment and you are unlikely to be protected if something goes wrong. Take 2 minutes to learn more
SHIBUSD Analysis: Market Heads Lower As Price Breaks Diagonal Support Downward
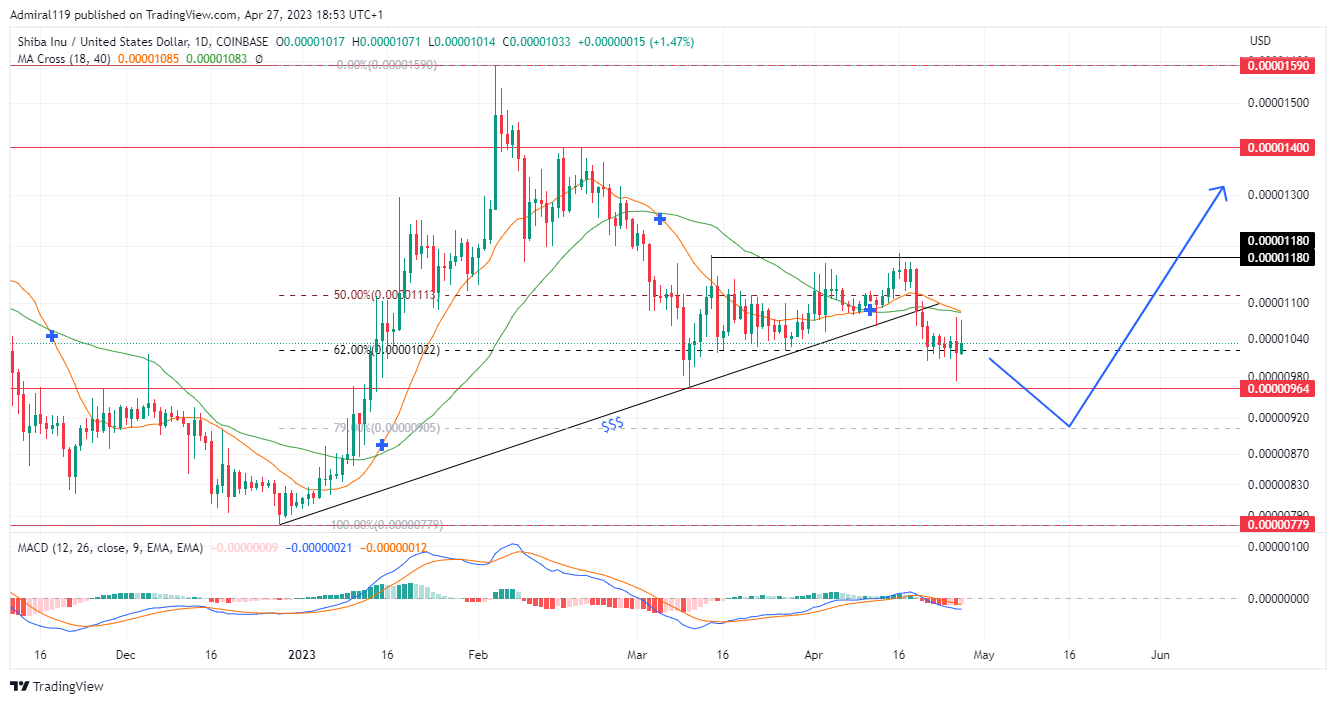
SHIBUSD heads lower as the price breaks diagonal support downward. Before the breakout, the market was in a consolidation phase. However, according to the Moving Average Convergence Divergence (MACD), the market has resumed its bearish trend. Revealed after crossing the zero line to the downside.
SHIBUSD Significant Zones
Demand Zones: $0.000009640, $0.000007790
Supply Zones: $0.000014000, $0.000015900

Owing to the reluctance of the price to keep declining, the market’s trend is likely to flip bullish. Earlier this year, the price rallied from the $0.000007790 demand level. SHIBUSD took less than six weeks to move from the $0.000007790 demand level to the $0.000015900 supply level. While the change of environment is imminent, prices are likely to still dive lower into the discount zone. A dive toward the 79.0% Fibonacci retracement level is probable before the price swerves upward.
Between the $0.000007790 support and the $0.000015900 resistance, the movement of SHIBUSD is constrained. The price collapsed sharply to the downside, invalidating the diagonal support that first appeared on December 28, 2022. As confirmed by the MA Cross, the market was bullish before the crash. After three bounces off the diagonal support, the crash happened. Due to the diagonal support’s failure, the price may crash further, maybe breaching the $0.000009640 demand level. Then there will probably be a continuation of the upward trend.
Market Expectation
A shift in market structure occurred on the four-hour chart before the major trendline got broken to the downside. Following the breakout, the price surged upward to return to a fair value gap. Until another market structure shift happens to the upside on the four-hour chart, SHIBUSD might continue declining.
You can purchase Lucky Block here. Buy LBLOCK
Note: Cryptosignals.org is not a financial advisor. Do your research before investing your funds in any financial asset or presented product or event. We are not responsible for your investing results.