Bitcoin Cash (BCH/USD) Price Features Lower Lows
Estimated Reading Time: 3 minutes
Don’t invest unless you’re prepared to lose all the money you invest. This is a high-risk investment and you are unlikely to be protected if something goes wrong. Take 2 minutes to learn more
Bitcoin Cash Price Prediction – January 28
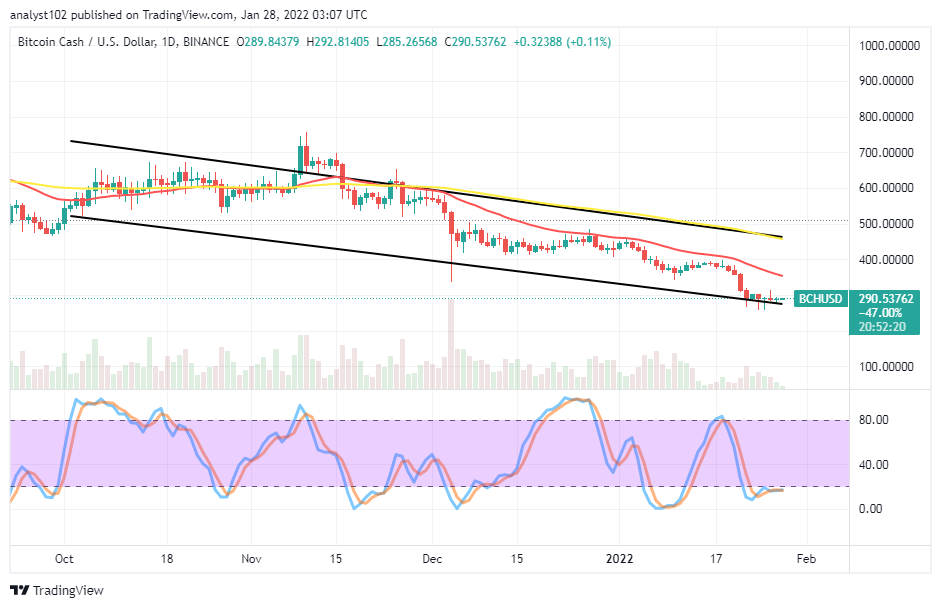
It has been on the BCH/USD financial book of records that the crypto-economic market price features lower lows at a minute positive percentage rate of 0.11. The crypto and the US economy trading activities are currently taking place between $292 and $285 lines as of writing.
BCH/USD Market
Key Levels:
Resistance levels: $350, $400, $450
Support levels: $250, $200, $150
BCH/USD – Daily Chart
The BCH/USD daily chart reveals the crypto-economic price features lower lows around $300 as some of the candlesticks that emerged possessed bottom shadows. That indicates some smaller-falling attempts have been at the value line. The 14-day SMA indicator is underneath the 50-day SMA indicator. The lower bearish channel trend lines drew southward to locate a point around the present trading spot. The Stochastic Oscillators are in the oversold region, with their lines clogged to signify that a consolidation movement is ongoing in the market.
Will the BCH/USD market prolong moving in a consolidation style around $300 as the crypto’s price features lower lows?
The BCH/USD trade seems not to attract much response from the market movers. And as a result, the crypto-economy stands the tendency of prolonging moving in consolidation style as price features lower lows around $300. If the smaller forces to the downside at the value line don’t get heightened, a line of upswings in the form of rallying may re-occur, pushing up to find resistance around the trend line of the 14-day SMA afterward.
On the downside of the technical analysis, the BCH/USD market bears appear to have exhausted their falling weights as the price is currently trading in an oversold spot. Therefore, it needed that short-position takers suspend further selling position orders for a while to allow a kind of momentums gathering to take place before getting a reversal signal at a higher level, in the long run, to be able to go for a re-launch of the sell order.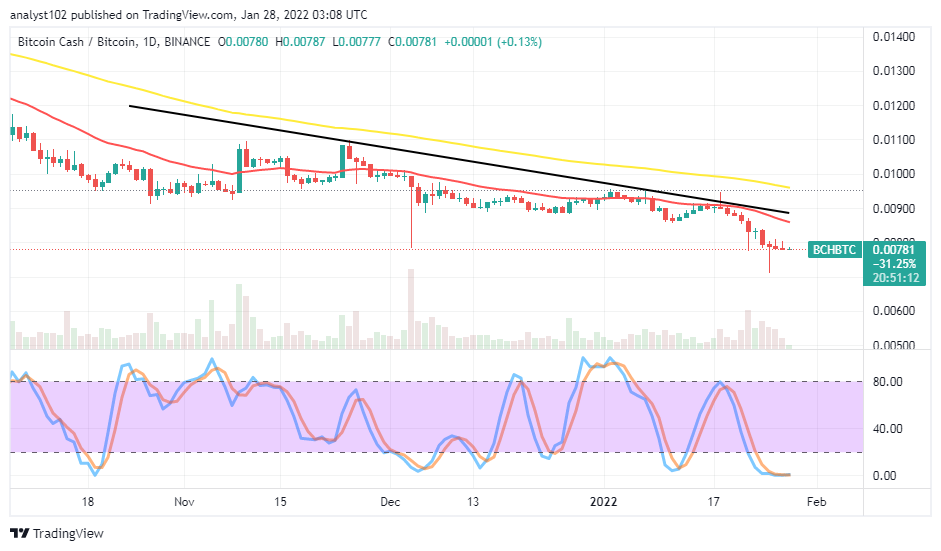
BCH/BTC Price Analysis
In comparison, Bitcoin Cash is still losing more stances to Bitcoin in trending capability. The cryptocurrency pair price features more lows underneath the trend lines of the SMAs over a couple of sessions. The 50-day SMA indicator is above the 14-day SMA indicator. The Stochastic Oscillators are in the oversold region with conjoined lines, seemingly showing a consolidation moving manner to signify the base crypto is under depressions as placed in pushing forces with the flagship counter crypto.
Note: Cryptosignals.org is not a financial advisor. Do your research before investing your funds in any financial asset or presented product or event. We are not responsible for your investing results.
You can purchase crypto coins here. Buy Tokens