Bitcoin Cash (BCH/USD) Price Lowers, Approaching $400
Estimated Reading Time: 3 minutes
Don’t invest unless you’re prepared to lose all the money you invest. This is a high-risk investment and you are unlikely to be protected if something goes wrong. Take 2 minutes to learn more
Bitcoin Cash Price Prediction – December 17
The financial record of the BCH/USD currently has it that the crypto-economic price lowers, averaging $400 line. The crypto market, as of writing, is trading around $436 at a smaller negative percentage rate of about 0.53.
BCH/USD Market
Key Levels:
Resistance levels: $500, $600, $700
Support levels: $350, $300, $250
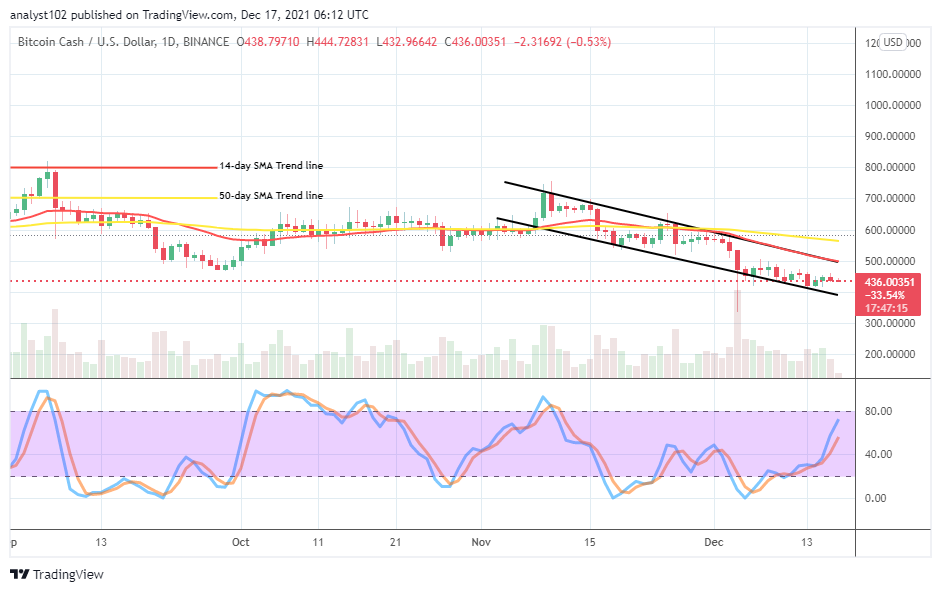
BCH/USD – Daily Chart
The BCH/USD daily chart reveals that the crypto-economic price lowers, approaching the $400 trading level. There have been differential smaller bearish candlesticks, occurring serially close to the lower bearish channel trend line drawn. The upper bearish channel trend line is drawn alongside the 14-day SMA indicator beneath the 50-day SMA indicator to ascertain the key resistance level that price will encounter afterward. The Stochastic Oscillators are seemingly swerving the lines northbound near beneath the range of 80. That suggests that the crypto economy still somewhat lacks the possibility of pushing back to the upside in the near time.
Is it still worth investing in the BCH/USD market activities as the crypto-economic price lowers, approaching $400?
Despite that the BCH/USD market still lacks the potency to regain its lost upward pressures; the situation provides an opportunity to now invest in the trade for a long-term basis as the price lowers, approaching $400. It has been that a support base will build around the value line. While that scenario is playing out, long-position takers will have to be on alert to notice a more-active move from that trading zone to be able to launch decent buy orders afterward.
On the downside of the technical analysis, the BCH/USD trade short-position takers may have to be patient until a while to observe, what will be, the market reaction around the $500 resistance level. If price tends again to succumb to a selling force after some time of holding a position, it means there will be room for seeing downs that sellers may momentarily ride on.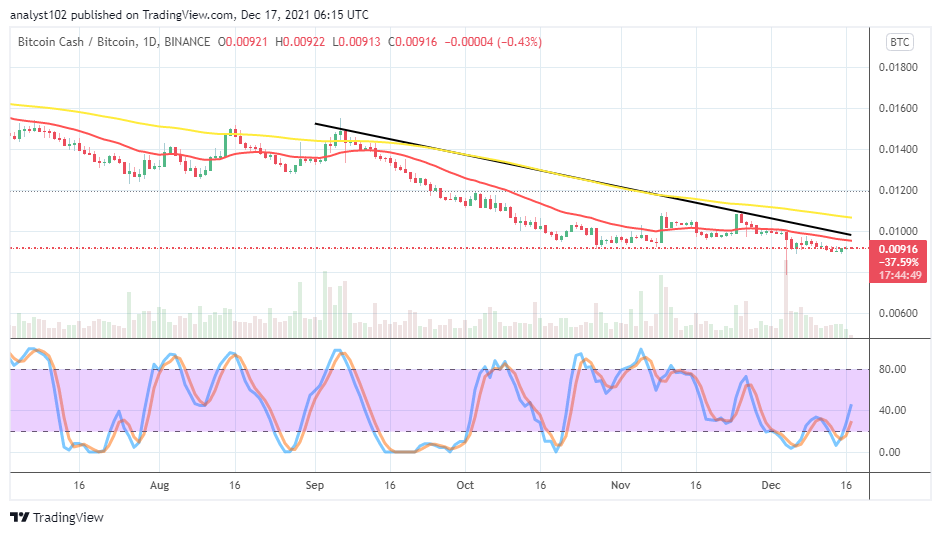
BCH/BTC Price Analysis
In comparison, Bitcoin Cash’s trending catalyst juxtaposed with Bitcoin still goes under-prevailed. In other words, the counter crypto dominates the trending capacity outlook at the expense of the base crypto over several sessions. The currency pair price lowers underneath the trend lines of the SMAs, sequentially showcasing tinier-smaller bearish candlesticks. The 50-day SMA indicator is above the 14-day SMA indicator. The Stochastic Oscillators are moving in a consolidation style, encompassing the range of 40 and down into the oversold region. That indicates the base crypto will still find pushing against the flagship counter crypto not easy for a while.
Note: Cryptosignals.org is not a financial advisor. Do your research before investing your funds in any financial asset or presented product or event. We are not responsible for your investing results.
You can purchase crypto coins here. Buy Tokens