Solana (SOL) Price Prediction: SOL/USDT May Plunge Below the $130 Baseline
Estimated Reading Time: 3 minutes
Don’t invest unless you’re prepared to lose all the money you invest. This is a high-risk investment and you are unlikely to be protected if something goes wrong. Take 2 minutes to learn more
Solana (SOL) Price Prediction: July 12
The Solana market made an appearance above the $100 mark in mid-December 2023. The market continued upwards, but its upside retracement ended when the price action popped through the $200 price level. The market tumbled a bit but seems to have settled above the $110 mark.
SOL/USDT Long-term Trend: Bearish (Daily Chart)
Key Price Levels:
Resistance Levels: $140, $150, and $160
Support Levels: $130, $120, and $110
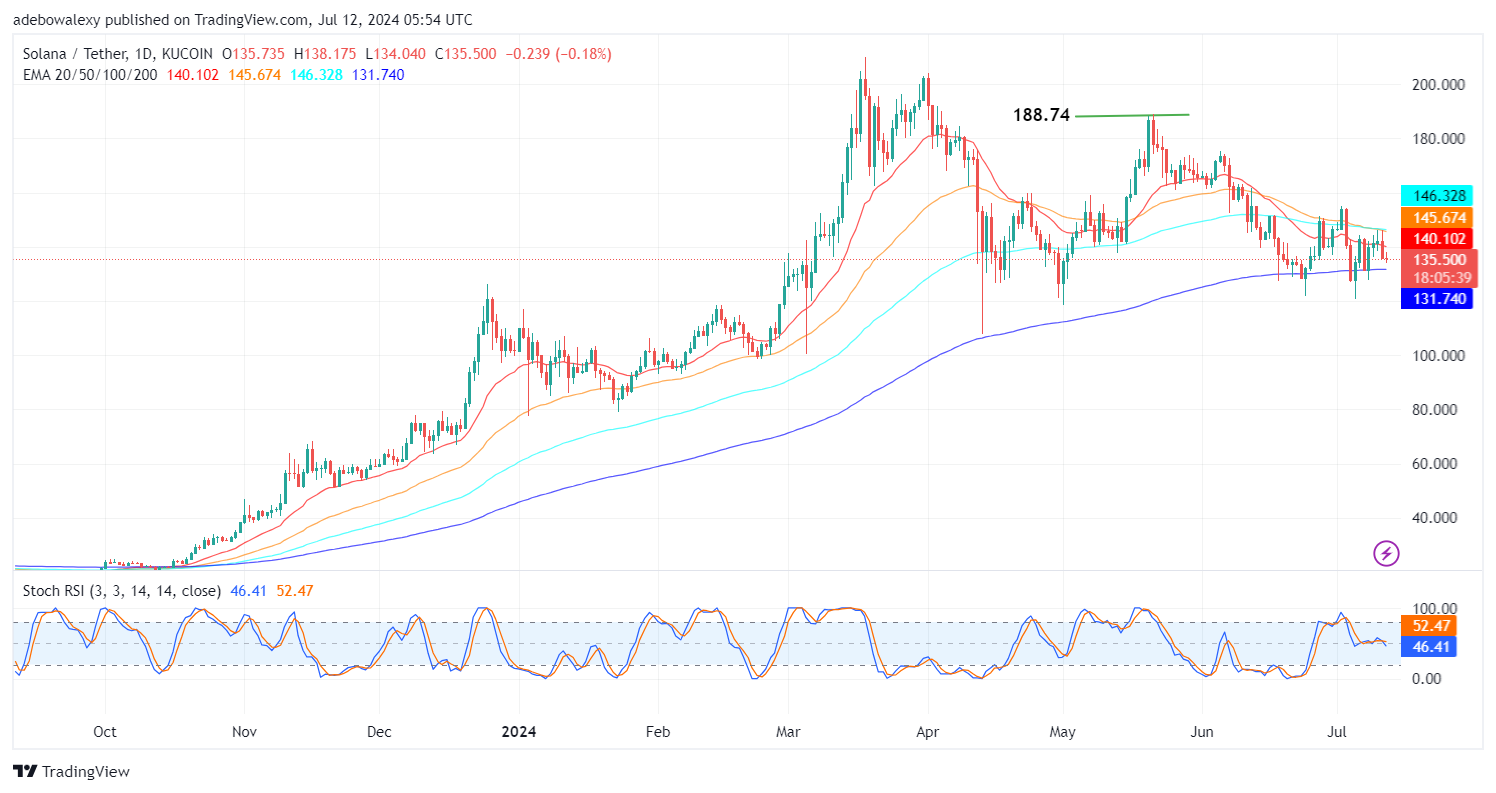
In more recent trading sessions, price action dipped below the 20-day Exponential Moving Average (EMA) lines. Meanwhile, the 50- and 100-day EMA lines can be seen crossing further above the price activity. The last price candle representing the ongoing session has presented further downward corrections towards the 200-day EMA. Meanwhile, the latest Stochastic Relative Strength Index (SRSI) indicator shows a downward crossover in the oversold region.
Solana Price Prediction: SOL/USDT Eyes Lower Support Levels
Signs emanating from the Solana market hint at a clear bearish market. The crossover of the 50- and 100-day EMA curves contributes to strong downward pressure on price movement. Additionally, the ongoing session has even fallen below the 20-day EMA curve.
Furthermore, the SRSI indicator lines show another bearish crossover at the 50-level mark of the indicator. Technically, this confirms the bearish intentions of market participants. Consequently, market forces are predisposed to maintaining dominance at this point, as price action seems more inclined to test the $130 support level.
SOL/USDT Medium-term Trend: The Solana Market Seeks a Psychological Support Level (4H Chart)
Extending the Solana price analysis to a much shorter timeframe of 4 hours, it can be seen that price activity has now fallen below all the EMA lines. Meanwhile, the last red price candle on this chart seems to have a more conspicuous body size, indicating that downward forces are dominating.
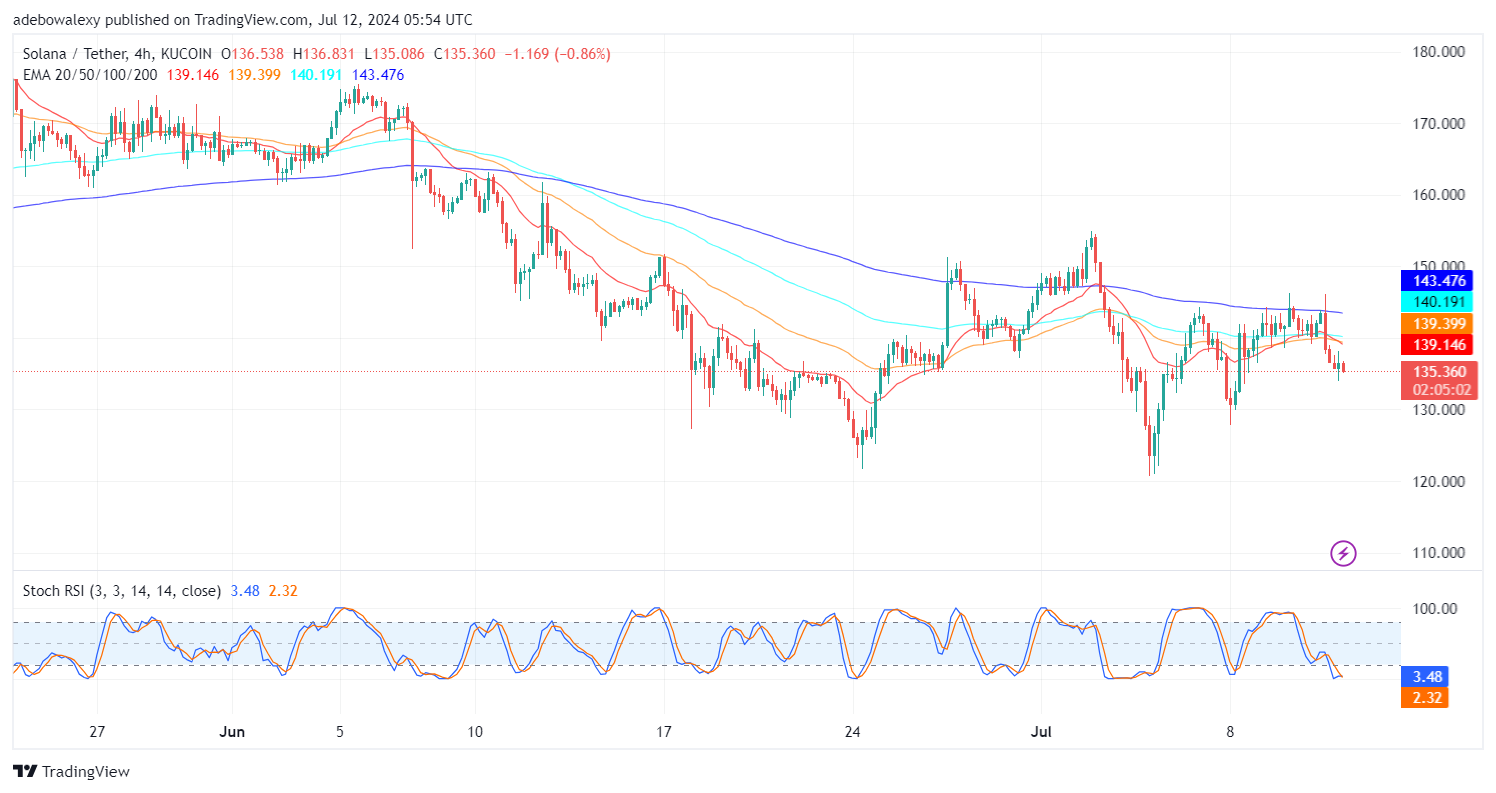
Likewise, the SRSI indicator lines can be seen converging earlier but seem to have resumed trending further downward into the oversold zone of the indicator. Although the SRSI lines are already in the oversold region, the behavior of the lines in this indicator suggests that they may drag on in the oversold region as the market continues to descend toward the $130.00 mark.