Uniswap (UNI) Price Prediction: UNI/USDT Consolidates Just Above the $8 Price Level
Estimated Reading Time: 3 minutes
Don’t invest unless you’re prepared to lose all the money you invest. This is a high-risk investment and you are unlikely to be protected if something goes wrong. Take 2 minutes to learn more

Uniswap (UNI) Price Prediction: July 11
Price movement in the Uniswap daily market surpassed the $8 threshold about two sessions ago. However, subsequent sessions in the market were unable to provide further lift as the market keeps trending sideways just above the $8 support level.
UNI/USDT Long-term Trend: Bullish (Daily Chart)
Key Price Levels:
Resistance Levels: $9, $11, and $13
Support Levels: $7, $6, and $5
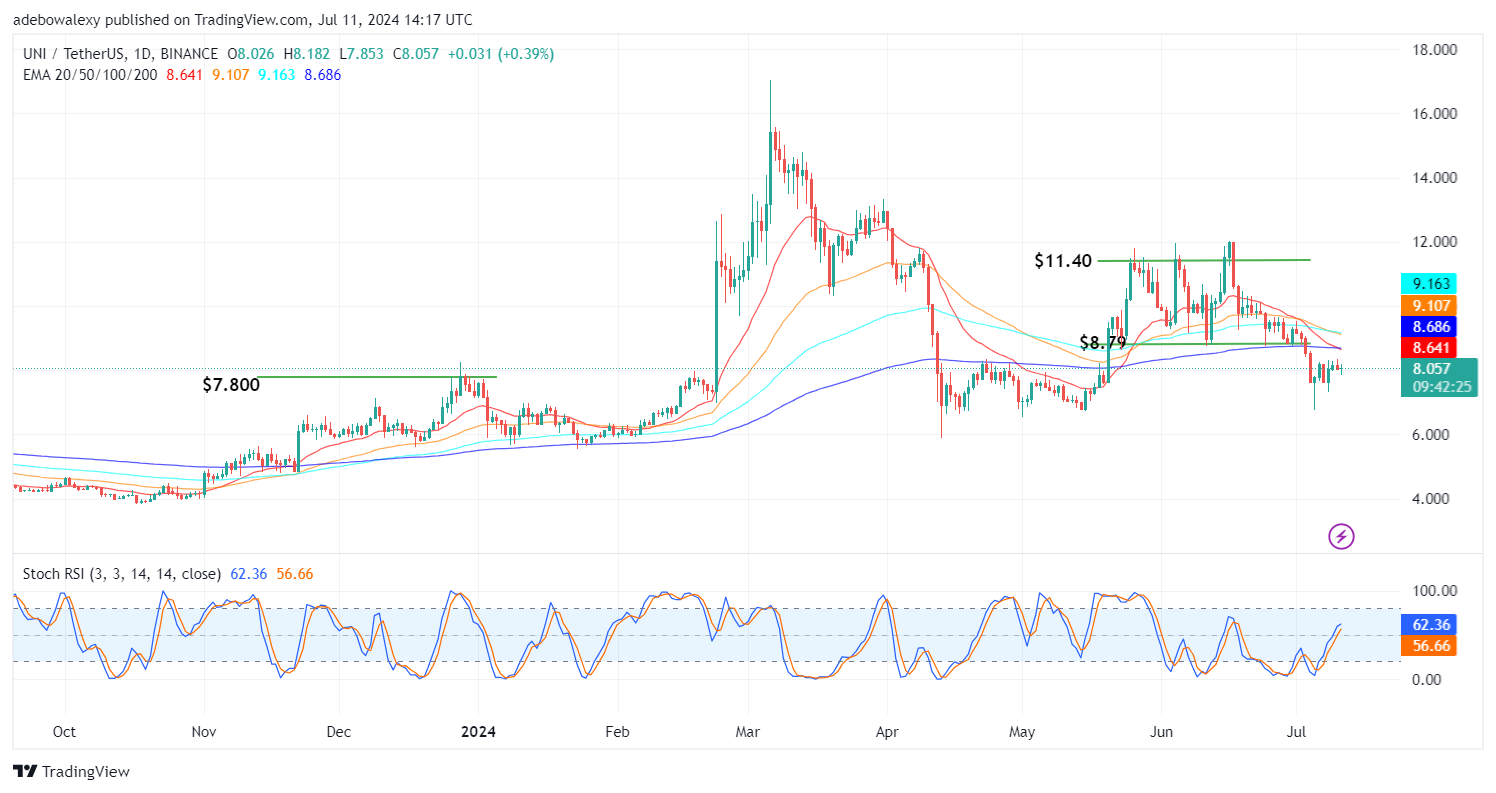
The price candle corresponding to the current session shows that market forces are at a stalemate. The price candle appears as a spinning top price candle below the converging lines of the Exponential Moving Average (EMA) indicator. Meanwhile, the Stochastic Relative Strength Index (SRSI) indicator still has a general upward bearing. Only a slight deflection can be noticed on the leading line of the indicator, reflecting the activity of downward forces.
Uniswap Price Prediction: UNI/USDT May Plunge Back Below the $8 Mark
The daily price chart for the Uniswap token reveals that price action is finding it quite difficult to progress after rising above the $8 mark. All the EMA curves are above price activity on the chart, delivering a crossover.
This shows that downward forces seem to have a bearish prospect in this market. However, the divergent opinion of the SRSI indicator lines contradicts the likely resulting trend. But should price action surrender support at the $8 mark, even the SRSI indicator lines may succumb to bearish forces as price action falls to a lower support level.
UNI/USDT Medium-term Trend: Technical Indicator in the Uniswap Market Stays Divergent (4H Chart)
Price activity on the UNI/USDT 4-hour market lurks around the 20-day EMA curve. Meanwhile, the ongoing session can be seen to have considerable contractions, to the extent that price action has retreated below the 20-day EMA. Despite this, the SRSI indicator lines here have similar characteristics to those on the daily price chart.
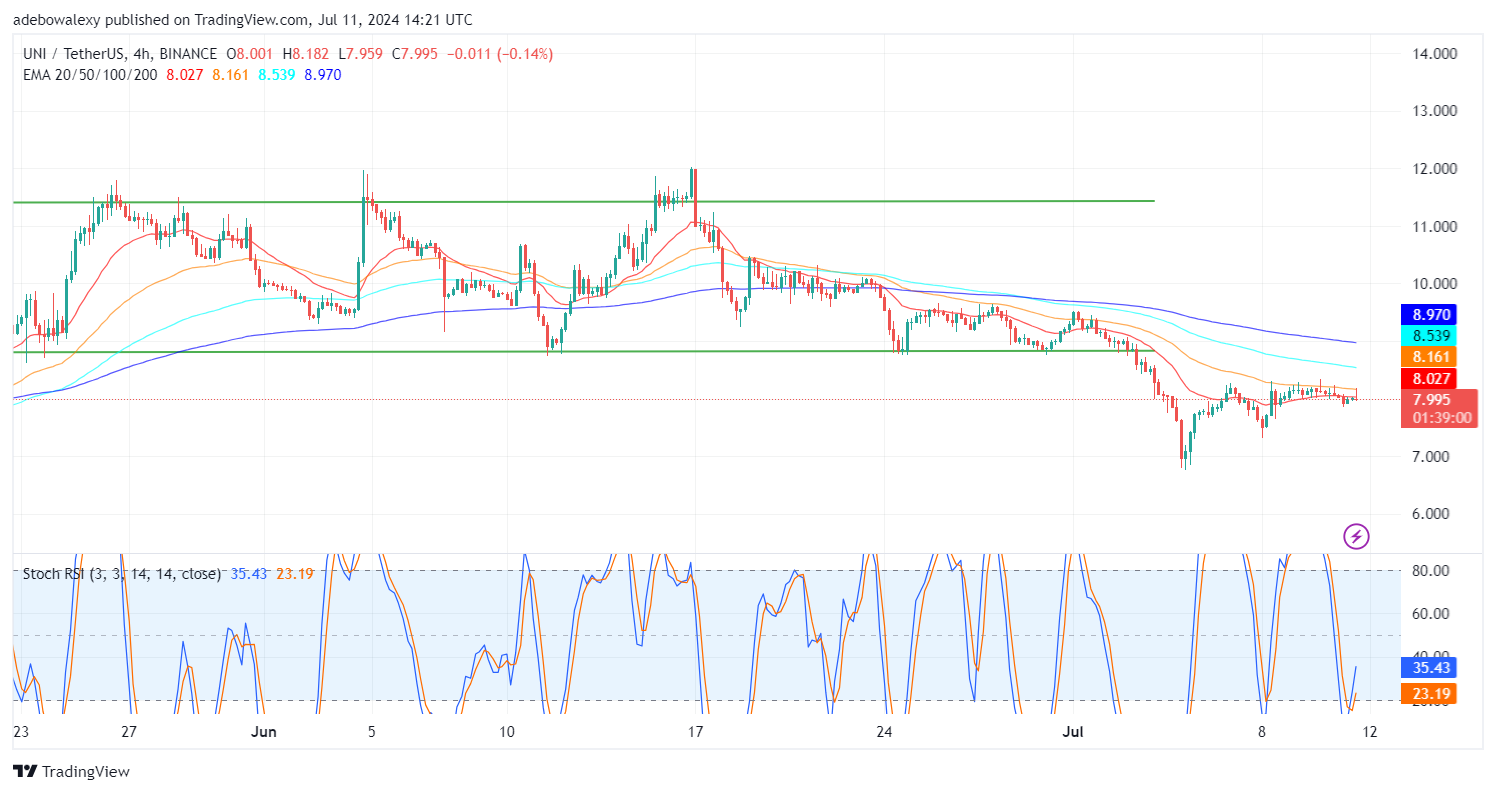
The SRSI indicator curves can be seen sticking to an upside path following a bullish crossover in the oversold region. Consequently, since the divergent nature seems consistent, traders may speculate that the market may rebound upwards soon towards the $8.50 or $9 mark. While this is possible, traders should exercise proper caution in this market.