Bitcoin (BTC) Price Prediction: BTC/USDT Is Eyeing the $65,000 Ceiling
Estimated Reading Time: 3 minutes
Don’t invest unless you’re prepared to lose all the money you invest. This is a high-risk investment and you are unlikely to be protected if something goes wrong. Take 2 minutes to learn more

Bitcoin (BTC) Price Prediction: July 10
Bitcoin recently dipped to the $55,000 mark. The market generally stayed above this mentioned psychological support and is currently retracing its steps back towards the $60,000 mark. Let’s check out what may soon occur in this market.
BTC/USDT Long-term Trend: Bullish (Daily Chart)
Key Price Levels:
Resistance Levels: $60,000, $65,000, and $70,000
Support Levels: $55,000, $50,000, and $45,000
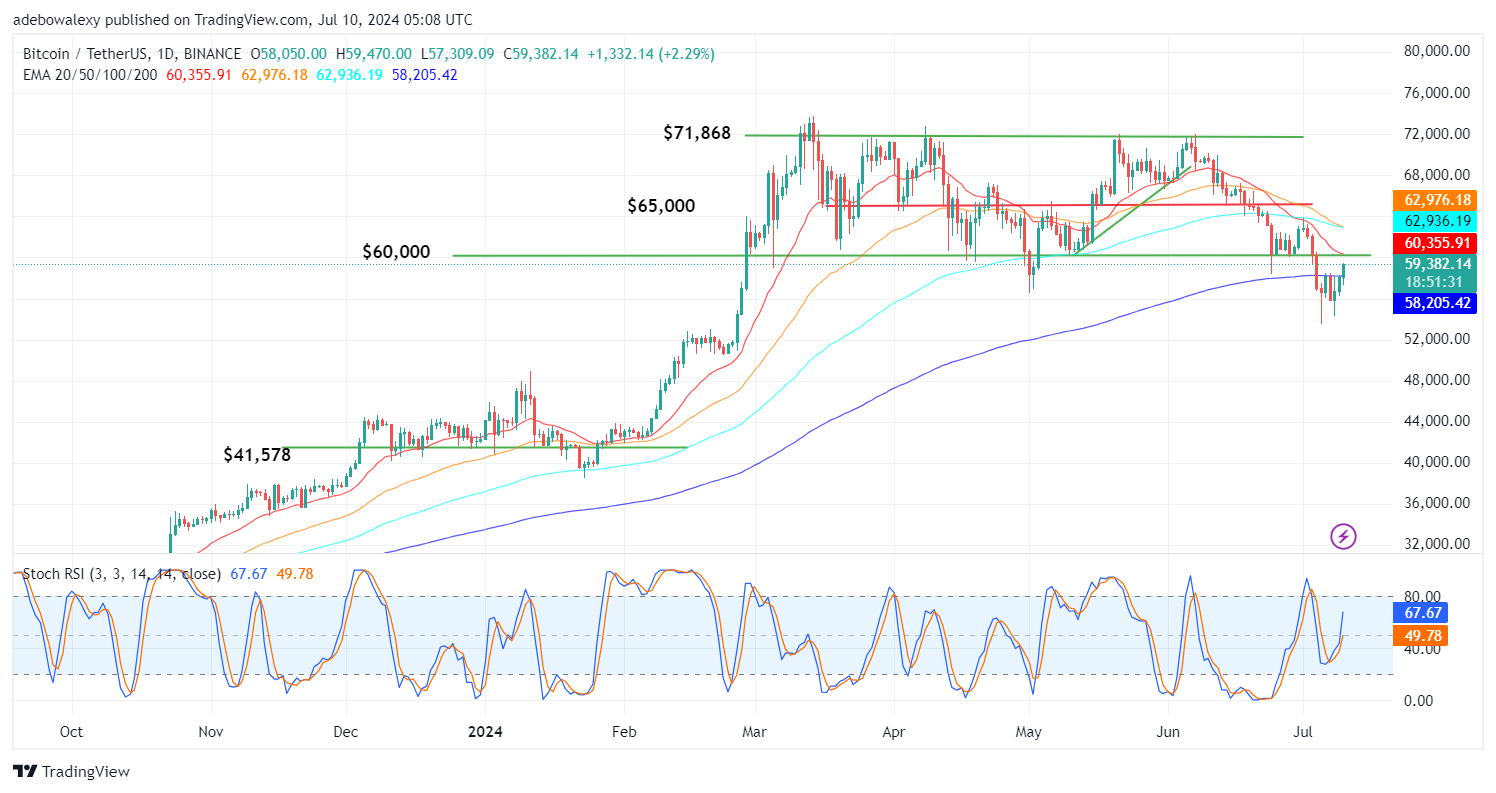
Today’s trading in the Bitcoin market so far has been particularly gainful. This is revealed through the corresponding price candle. The last price candle on the daily chart can be seen rising above the 200-day Exponential Moving Average (EMA) lines. Also, the price candle has no upper shadow and therefore suggests that downward forces aren’t exerting pressure on the market. Furthermore, the Stochastic Relative Strength Index (SRSI) indicator curves can be seen rising from the oversold region. The leading line of the indicator can be seen to have increased through the 50 level and is now at the 67 mark, while the lagging line remains just below the 50 level.
Bitcoin Price Prediction: BTC/USDT On Course Toward the $60,000 Mark
The indications from the Bitcoin daily chart suggest that price action in the market is fast gaining traction. The corresponding price candle for the ongoing session lacks an upper shadow as of the time of writing. This signals that downward forces may be down and out. In addition, the market can be seen to have risen past the 200-day EMA line.
Meanwhile, the SRSI indicator lines can also be seen rising steeply upward from the oversold region. A close look at the line will reveal that there is a significant distance between the two lines of the SRSI, and this points to healthy volatility. Consequently, this may help the market rise quickly through the $60,000 threshold.
BTC/USDT Medium-term Trend: Bitcoin Continues to Secure Upside Support (4H Chart)
The BTC/USDT 4-hour chart has revealed that price action in the market is fast rising. Moving on from the activity on the daily price chart, price action can be seen to have risen above the 20 and 50-day EMA curves. The last price candle seems quite large and places the market towards more elevated EMA lines such as the 100- and 200-day.
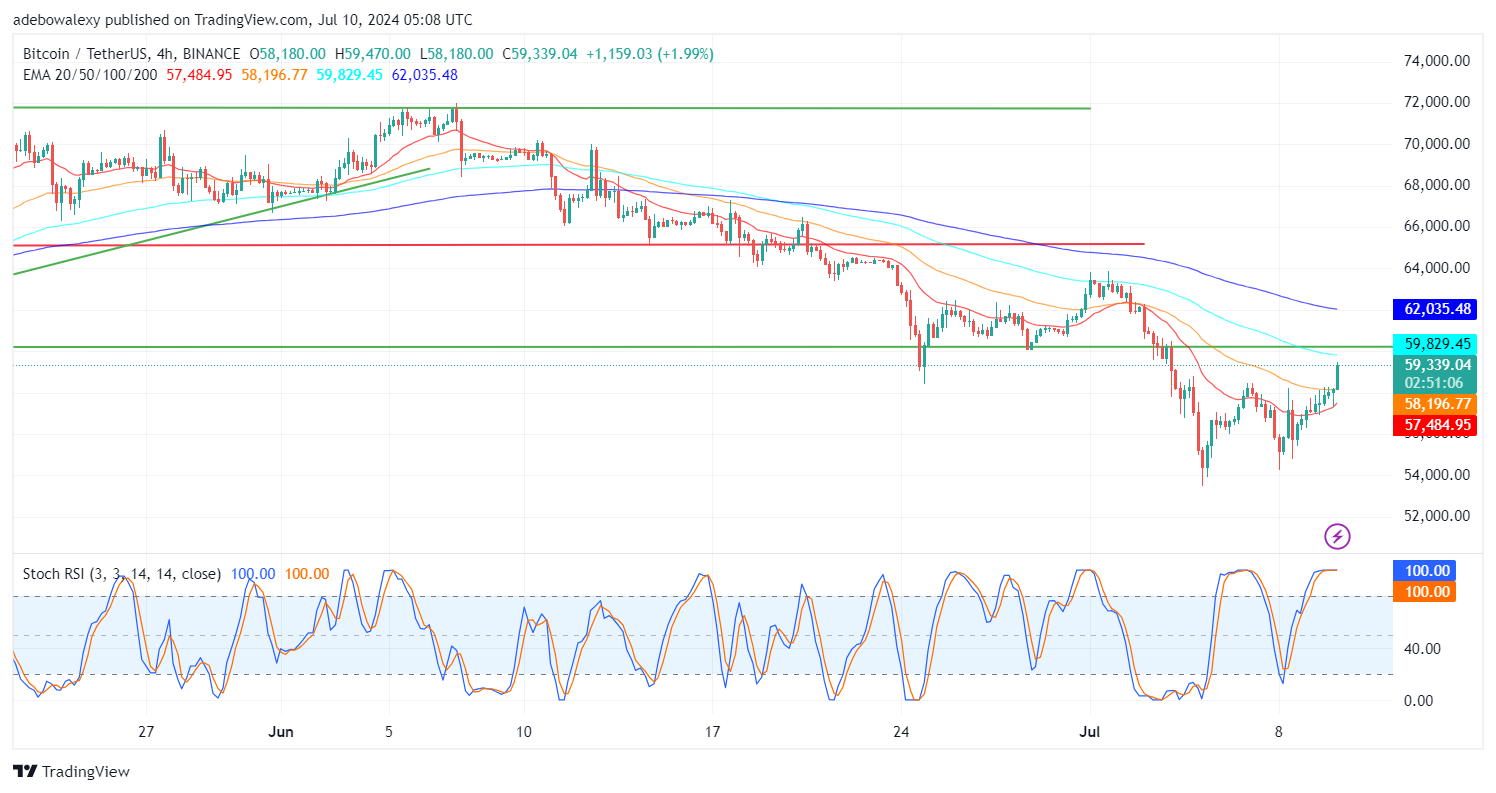
Meanwhile, the SRSI indicator lines can be seen to have reached the 100 mark of the indicator and are now dragging sideways as upside forces persist. Indications arising from here reveal that this market has upside prospects, which appear to be strengthening as trading progresses. This will likely strengthen bullish convictions and may propel the market through the $60,000 mark. However, traders should exercise caution and keep their targets below the $65,000 threshold.