Litecoin (LTC) Price Prediction: LTC/USDT Is Eyeing the $70.00 Ceiling
Estimated Reading Time: 3 minutes
Don’t invest unless you’re prepared to lose all the money you invest. This is a high-risk investment and you are unlikely to be protected if something goes wrong. Take 2 minutes to learn more

Litecoin (LTC) Price Prediction: July 9
The Litecoin token has come a long way since it was launched in 2011 at a price of approximately $0.30. The coin saw an all-time high of $412 in 2021 but now trades below the $70 threshold. This token recently tested its support at the $60 price level. However, yesterday’s and today’s trading sessions have been able to keep the market afloat at $60, trading at the $65 mark at the time of writing.
LTC/USDT Long-term Trend: Bullish (Daily Chart)
Key Price Levels:
Resistance Levels: $70, $80, and $90
Support Levels: $60, $50, and $40
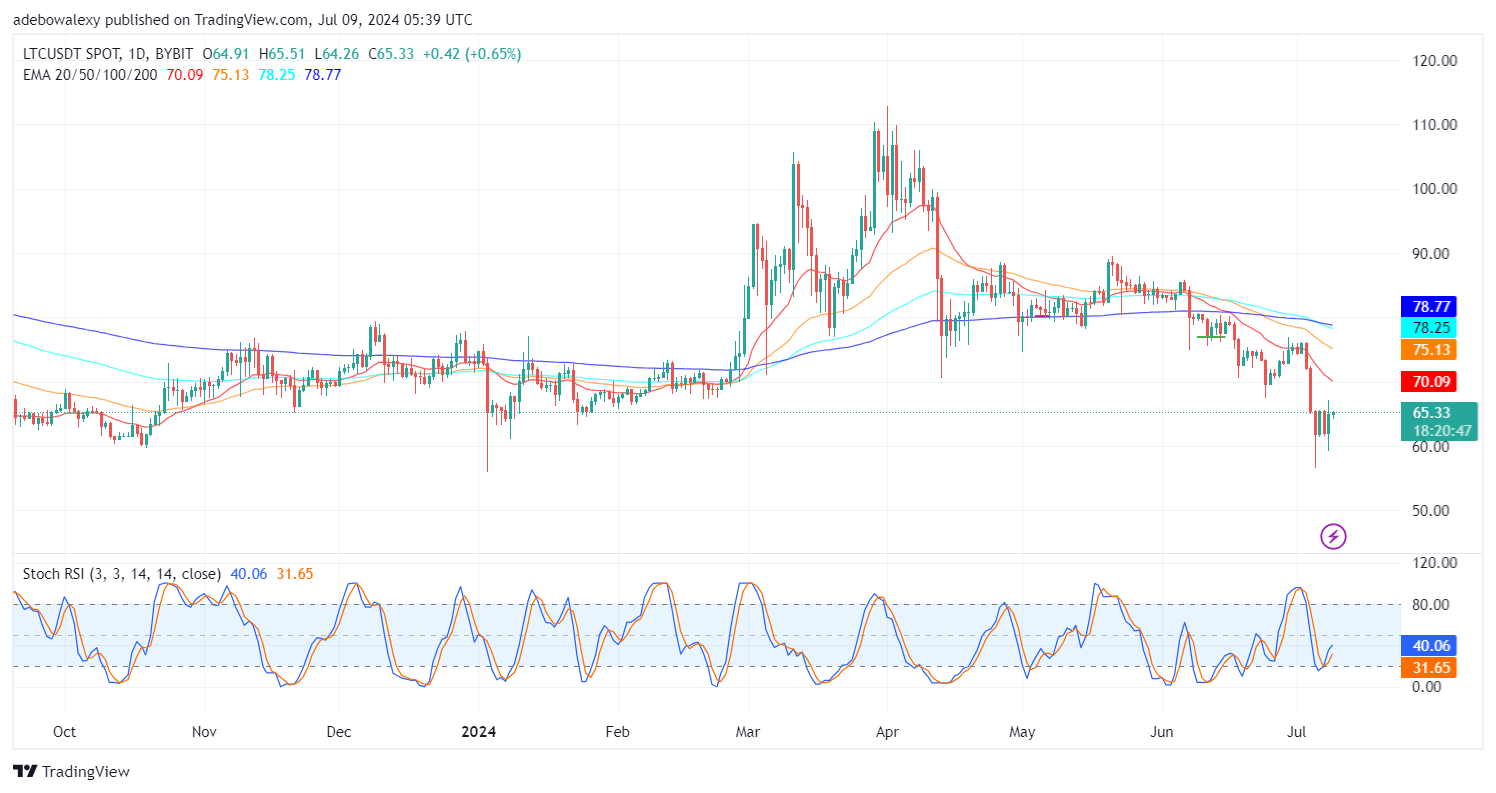
Prices in the Litecoin daily market rebounded yesterday, bringing the market further afloat above the $60 technical support level. Today’s session can be seen appearing as a small-bodied price candle but also below all the Exponential Moving Average (EMA) lines. Meanwhile, the Stochastic Relative Strength Index (SRSI) lines have been rising upward from the oversold region following an upside crossover. However, the terminal part of the leading line of this indicator can be seen deflecting a little bit.
Litecoin Price Prediction: LTC/USDT Starts Another Positive Session
Price movement in the Litecoin daily price chart has revealed that today’s trading activity, as of the time of writing, has remained under the control of upside forces. Although signs from technical indicators hint that upside forces are currently being challenged, this can be perceived as price action remains below all the EMA indicator lines on this chart.
Consequently, this somehow shows that downward forces are still formidable in causing further price declines in the market. Also, the SRSI indicator lines have risen upward but are still in the oversold region. The leading line of the indicator can be seen deflecting already. The mentioned deflection hints that downward forces are exerting some pressure.
LTC/USDT Medium-term Trend: Litecoin Claims Bits of Profit Above Important Support (4H Chart)
Price activity has risen past the 20-day EMA lines. Since the past three sessions, price action has reclaimed support above the 20-day EMA line. Subsequent sessions have crawled further upward above the mentioned indicator line. The SRSI indicator lines have delivered an upward crossover in the oversold region.
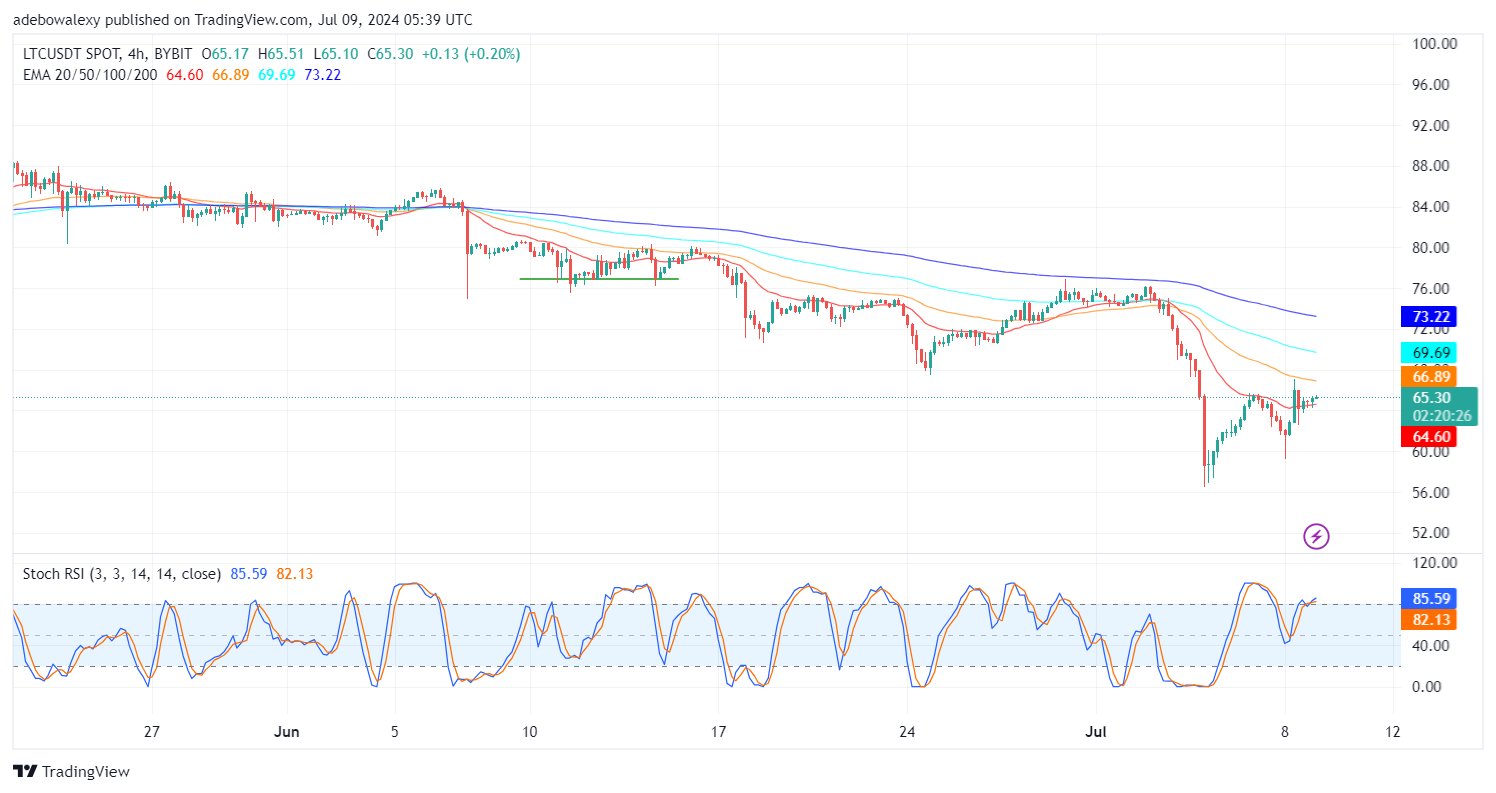
However, it is worth noting that price volatility has reduced significantly and may attract more support from bullish traders. Technically, the market is still progressing based on information emanating from technical indicators. Nevertheless, traders may have to exercise patience until the market hits the $67 price mark before making more reliable bullish decisions.