Tamadoge (TAMAUSD) Finds a Sure Footing at the $0.0100 Price Level
Estimated Reading Time: 3 minutes
Don’t invest unless you’re prepared to lose all the money you invest. This is a high-risk investment and you are unlikely to be protected if something goes wrong. Take 2 minutes to learn more
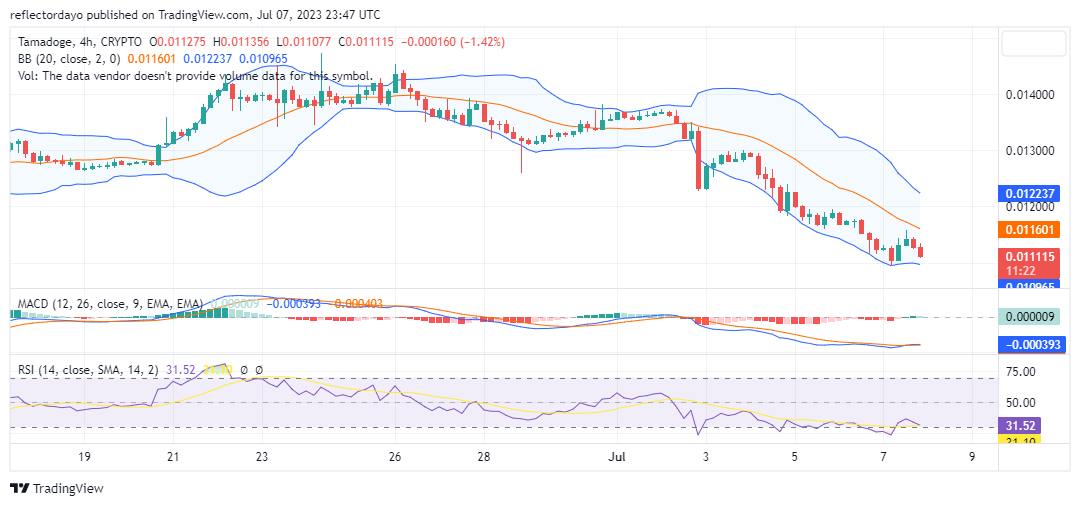
Tamadoge (TAMAUSD) has experienced challenges in staging a rebound from the $0.011668 price level, despite trapping the bear market into a consolidation trend. The bulls were unable to maintain control, succumbing to bearish pressure and regrouping at the $0.0100 price level.
Key Levels
- Resistance: $0.035, $0.040, and $0.045
- Support: $0.012, $0.011, and $0.010.
TAMAUSD Price Analysis: The Indicators’ Point of View
However, a recent TAMAUSD Price rebound from the $0.0100 support level can be observed. It is important to note that the lower standard deviation curve of the Bollinger Bands indicator has started moving along the edge of the $0.0100 price level. This suggests that the market is currently experiencing lower volatility in price movements.
On the other hand, the upper standard deviation curve and the 20-day moving average continue to move in a bearish direction. This indicates that the overall trend remains bearish, with selling pressure still present in the market. However, at the $0.010 price level, the trend is most likely to reverse.
Traders and investors should closely monitor the price action around the $0.0100 support level. As the bull market issues from this level, the current level of the 20-day moving average might be the area of the next resistance. More bullish force is needed to break the barrier and turn the market around.
Tamadoge Short-Term Outlook: 1-Hour Chart
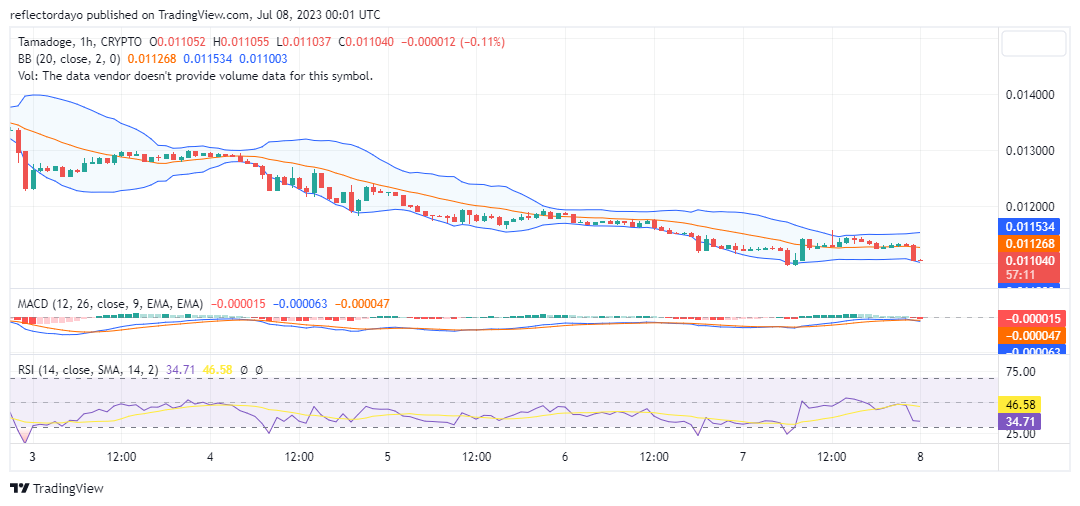
In the 1-hour timeframe, Tamadoge (TAMAUSD) shows signs of key support level strength as the bearish price was swiftly rejected, resulting in the price settling around the equilibrium level. The price has been moving along with the 20-day moving average, indicating a potential equilibrium between buyers and sellers.
However, in the 20th hour of the previous daily trading session, bears exerted downward pressure on Tamadoge, driving the market towards the support level once again. This suggests that bears remain active and are attempting to break below the key support level. However, a strong bull market can be triggered from this level. Bulls seem strong around this price level.
Watch for additional development as we get on with our construction!
✨FIRST LOOK AT OUR NEW 3D NFTs✨
Have you ever seen a cuter Tamadoge in your life??
Beware though… their bark is just as lethal as their bite when equipped with the right power-ups to dominate the leaderboards 💪🏼😏
Keep an eye out for more progress as we continue to build! pic.twitter.com/InPo2TvpPZ
— TAMADOGE (@Tamadogecoin) July 7, 2023
Do you want a coin that will be 100 times more valuable in the next few months? That is Tamadoge. Buy TAMA today!