Bitcoin Cash (BCH/USD) Price Remains in a Downward Trend
Estimated Reading Time: 3 minutes
Don’t invest unless you’re prepared to lose all the money you invest. This is a high-risk investment and you are unlikely to be protected if something goes wrong. Take 2 minutes to learn more

Free Crypto Signals Channel
Bitcoin Cash Price Prediction – June 10
There has been a further slight decline in the BCH/USD trade operations as the crypto’s price remains in a downward trend outlook. The current trading spots are between $176 and $170 in the last several hours.
BCH/USD Market
Key Levels:
Resistance levels: $200, $250, $300
Support levels: $150, $100, $50
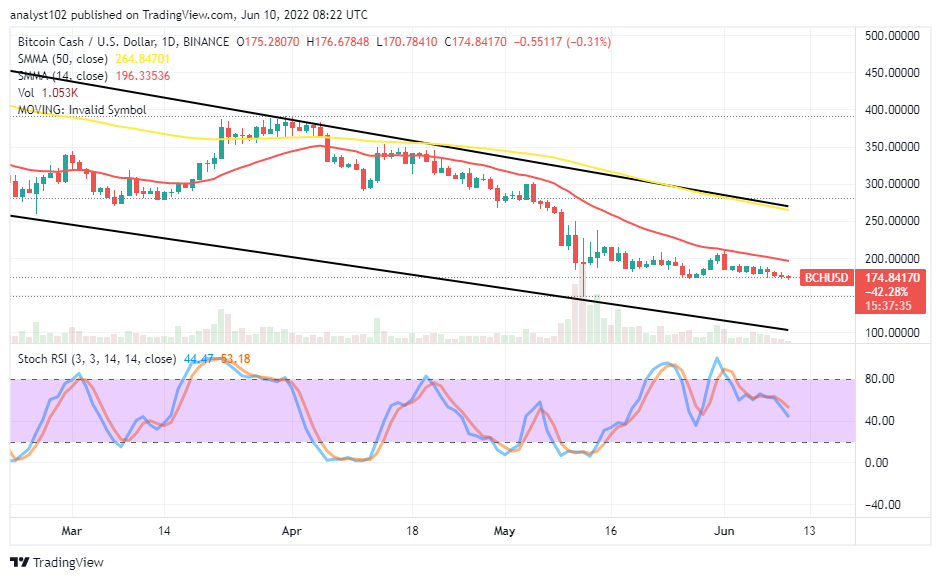
BCH/USD – Daily Chart
The BCH/USD daily chart showcases the market price remains in a downward trend beneath the trend line of the smaller SMA. The upper bearish channel trend line drew closely around the 50-day SMA indicator above the 14-day SMA. The lower bearish trend line has drawn to touch the lower support level. The Stochastic Oscillators have systemically crossed southbound toward the 40 range to signify a falling force is in place.
Will the BCH/USD market still feature around the $200 resistance level?
There will be a likelihood that the BTC/USD market features around the $200 resistance level as long as no bullish candlestick emerges fearfully to breach past the 14-day SMA trend line to the upside. Long-position takers would have to exercise more caution in the process to get a decent buying entry that can surface after the price might have hit a support point at a lower-trading zone afterward.
On the downside of the BCH/USD market analysis, selling pressure spanning closely from the beneath the smaller SMA trend line tends to extend serially in smaller sizes through variant support levels for some time. It is that the $200 resistance level will play a crucial role in determining bullish trend resumption at a later session. It’s noteworthy the market presently ranges between $200 and $150.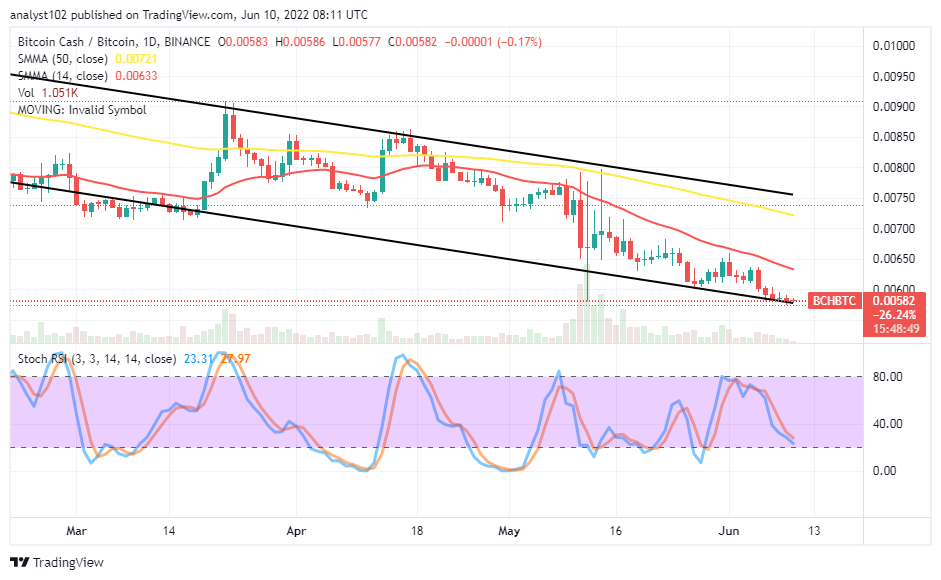
BCH/BTC Price Analysis
In comparison, Bitcoin Cash market activity has been intensely going down against Bitcoin’s trending ability. The cryptocurrency pair price remains in a downward trend outlook underneath the trend lines of the SMAs. The 14-day SMA indicator is below the 50-day SMA indicator. And they are kept within the bearish channel trend lines drawn. The Stochastic Oscillators are southbound, positioned closer to the range of 20. The base crypto may still go further down at a low pace against the counter crypto.
Note: Cryptosignals.org is not a financial advisor. Do your research before investing your funds in any financial asset or presented product or event. We are not responsible for your investing results.
“Lucky is up more than 50% today but still more than 430% from All Time Highs!
The opportunity to bank BIG is now!
You can purchase Lucky Block here. Buy LBlock