Bitcoin Cash (BCH/USD) Reverses to Touch the Support Level of $1,100
Estimated Reading Time: 3 minutes
Don’t invest unless you’re prepared to lose all the money you invest. This is a high-risk investment and you are unlikely to be protected if something goes wrong. Take 2 minutes to learn more
Bitcoin Cash Price Prediction – May 14
There has a financial update record that the BCH/USD market has reversed downward to touch a support area of $1,100 as price now trades around $1,251 at a 0.43% decrease as of writing.
BCH/USD Market
Key Levels:
Resistance levels: $1,400, $1,500, $1,600
Support levels: $1,100, $1,000, $900
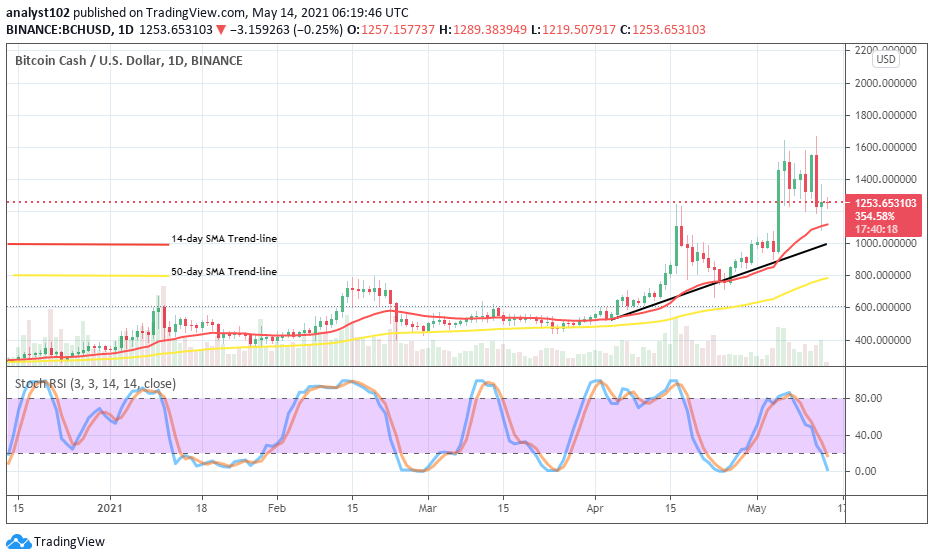
BCH/USD – Daily Chart
After a line of variant candlesticks converged around the market value of $1,400, the BCH/USD daily chart recorded a lower touch of $1,100 support level during yesterday’s trading session. But, today, presently witness a light-weighted candlestick a bit over the $1,200 level. The 14-day SMA is located around the mid-point of $1,000 and $1,200 values as the bullish trend-line drew to place lower at the latter line pointing towards the north. The 50-day SMA indicator is far positioned underneath them at about a value of $800. The Stochastic Oscillators have dipped into the oversold region to point towards the south. And, that suggests that some slight downs may still be witnessed in the market.
Will BCH/USD push more for a lower support?
Pushing more lowly for support by the BCH/USD market will have to be determined by a successful breakdown of the 14-day SMA trend-line at the trading area of $1,100 in the next volatile movement of the crypto-economy. That said, should that sentiment play out accordingly, the earlier price point mentioned will afterward serve as one of the best lines that investors may consider joining the market again.
On the contrary to the upsides, bears now have to add more muscle to hold down the crypto-trade back below the level of $1,100 breaking through some supports beyond the bullish trend-line drew. However, such presumed downward are most likely to create a panic sell-off trading situation that may potentially get most of the sell-entries at material time caged in no time.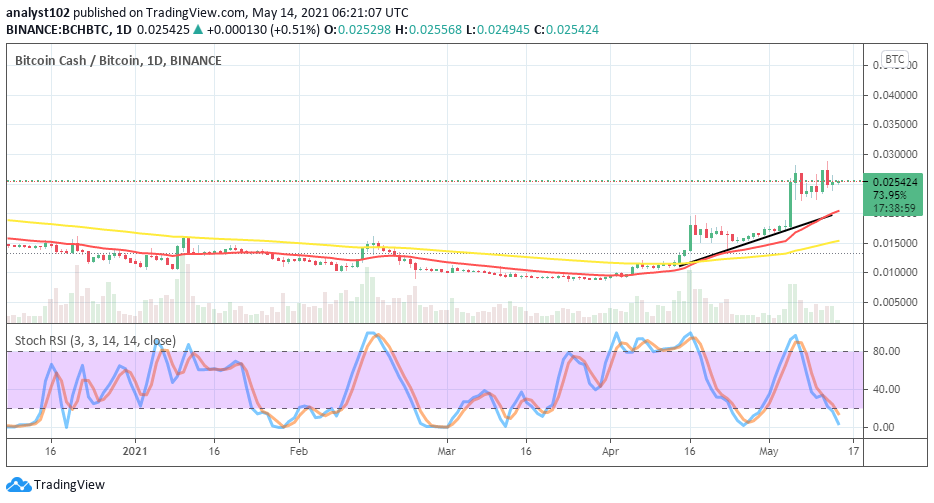
BCH/BTC Price Analysis
The flagship counter trading instrument is still outpaced by the market trading motion of the base crypto on the comparison scale presently as depicted on the BCH/USD chart. The bullish and the 14-day SMA trendlines are closely drawn pointing to the north over the 50-day SMA indicator. A line of different candlesticks is converging over the indicators to affirm that the base tool seems to be consolidating its dominance as paired with its counter instrument. The Stochastic Oscillators are in the oversold region slightly pointing to the south. At this point, traders need to be watchful of an emergence of a bullish candlestick to be able to have a clear picture of the base tool’s further dominance of the market.
Note: cryptosignals.org is not a financial advisor. Do your research before investing your funds in any financial asset or presented product or event. We are not responsible for your investing results.