Bitcoin Cash (BCH/USD) Swings Northbound for Recovery
Estimated Reading Time: 3 minutes
Don’t invest unless you’re prepared to lose all the money you invest. This is a high-risk investment and you are unlikely to be protected if something goes wrong. Take 2 minutes to learn more
Bitcoin Cash Price Prediction – June 25
A further drop has been recorded in the valuation of BCH/USD while it is at $400. The market now swings northbound for recovery to trade at the level of 473 at a percentage rate of about -2.73.
BCH/USD Market
Key Levels:
Resistance levels: $600, $800, $1,000
Support levels: $400, $300, $200
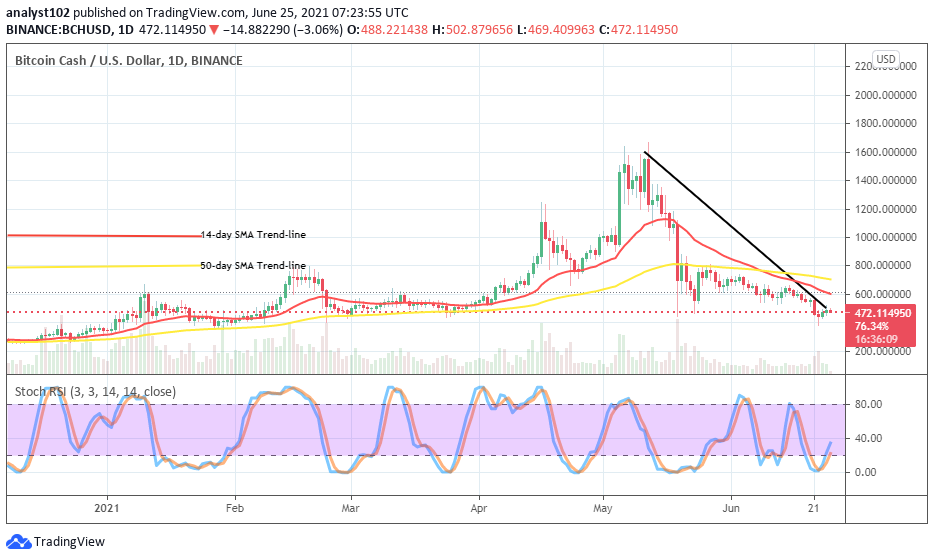
BCH/USD – Daily Chart
The BCH/USD daily chart reveals that the crypto’s value has declined slightly past below the level of $400 during the June 22nd trading day’s time. But, momentarily, the price began to swing northbound for recovery near the bearish trend-line. The 14-day SMA trend-line is underneath the 50-day SMA indicator over the bearish trend-line that drew across them southward. The Stochastic Oscillators have crossed the lines from the oversold region toward the northbound closer to range 40. That signals that some upswings are in the crypto-space trading situation.
As the BCH/USD price swings northbound for recovery from $400 support, will it be stable?
The BCH/USD market level support of $400 appears to be a reliable baseline where an upswing made around that zone could give a forecast of subsequent upsides. It could as well be one of the valid zones that investors needed to consider now. However, a pit stop could also surface around the levels of $500 and $700 to probably cause a panic sell-off trading situation.
In the technical analysis viewing of the current market moving manner, the downside moving capability possesses lower moving-force to rely upon while price tends to downsize further. The market point of around $500 has been to probably be the actual zone where the BCH/USD bears now seem to have the better advantage to re-launch their positions in the crypto trade.
BCH/BTC Price Analysis
In comparison, the trending capacity of Bitcoin Cash pairing with Bitcoin is not having a stance as of now as it depicted on the price analysis. The 14-day SMA trend-line is somewhat trying to intercept the 50-day SMA indicator from the top to the south as the bearish trend-line remains drawn down across them. The 14-day SMA trend-line is somewhat trying to intercept the 50-day SMA indicator from the top to the south as the bearish trend-line remains drawn down across them.
Note: new.cryptosignals.org is not a financial advisor. Do your research before investing your funds in any financial asset or presented product or event. We are not responsible for your investing results.
You can purchase crypto coins here. Buy Tokens