Hyperliquid (HYPEUSDT) Faces Resistance Amidst Downward Pressure
Estimated Reading Time: 3 minutes
Don’t invest unless you’re prepared to lose all the money you invest. This is a high-risk investment and you are unlikely to be protected if something goes wrong. Take 2 minutes to learn more

Apparently, the market for Hyperliquid against Tether appears to be structured by a constant struggle between the bulls and bears. The market at the moment is recording a 24-hour increase of 0.9% against a 19.85% weekly decline.
As it stands, it looks like the planned strategic partnerships and mixed sentiment around the upcoming token unlock seem to be the factors behind this move as the pair stabilizes near a key support level.
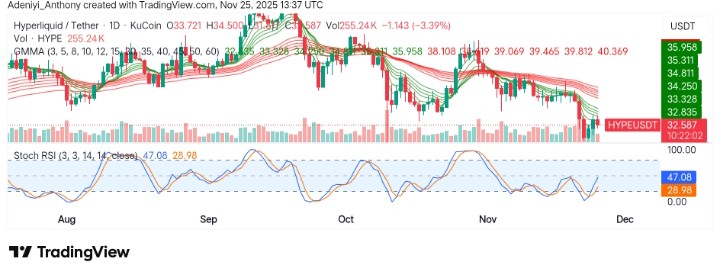
On the daily chart, Hyperliquid is currently trading at $32.587, with over 255,000 traded volume for the day.
Technical Indicators
Major Resistance Levels: $34.05, $36.65, and $40.00
Major Support Levels: $31.80, $30.00, and $29.00
Technical Analysis
Technically, Hyperliquid against Tether on the daily chart shows a clear downtrend. This indicates a bearish market sentiment, as the current price shows the pair is struggling to maintain support above $33.00.
To this end, the Stochastic RSI suggests potential for a change in narrative, as the lines trend to the north from the oversold zone.. This suggests a move above $36.00 may be imminent if current momentum is sustained.
If you were bullish on $HYPE one or two months ago
I don’t see a reason why you shouldn’t be bullish here
HIP3 is going to cross $500M daily Volumes this week and likely break $1B daily volumes within 2-3 weeks from now.
House of all finance. pic.twitter.com/j8VguhtLAH
— x256.hl (@x256xx) November 24, 2025
Meanwhile, @x256xx has expressed continued bullishness on $HYPE. The analyst stated that if one was optimistic about the asset a month or two ago, there’s no reason not to remain so now. The analyst predicts that HIP3 will surpass $500 million in daily trading volumes this week and is likely to reach $1 billion within the next 2-3 weeks.
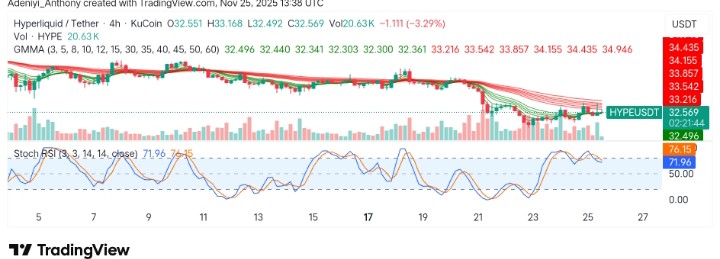
HYPE/USDT Analysis: Gearing up for a Short-term Upside Move
On the 4-hour chart, HYPE/USDT shows a short-term bearish trend. The price has recently been capped by a strong resistance zone around $33.94, with the Stochastic RSI entering an overbought region. Meanwhile, the recent uptick in price up to $33.94 is met with selling pressure, as indicated by the flattening moving averages.
To this end, if a breakout above this resistance is sustained, further upside may be recorded. However, a slight dip for further improvement to the north may materialize.
You can purchase crypto coins here. Buy Crypto