Hyperliquid (HYPE/USDT) Faces Resistance Amid Market Volatility
Estimated Reading Time: 3 minutes
Don’t invest unless you’re prepared to lose all the money you invest. This is a high-risk investment and you are unlikely to be protected if something goes wrong. Take 2 minutes to learn more

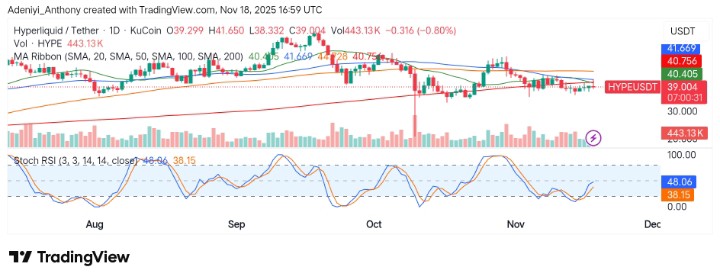
The market for Hyperliquid against Tether in recent times has faced strong pressure, as indicated by the interplay between the cluster of moving averages and price fluctuation. However, despite the recent pullback, the pair has maintained its positioning between the 200- and 20-period simple moving averages.
As it stands, the technical indicators and the price appear to be displaying a bearish tendency, as seen in the behavior of the Stochastic RSI.
Currently, Hyperliquid trades at $39.004 with over 443 thousand traded volumes for the day.
Technical Indicators
Major Resistance Levels: $40.753, $41.659, and $44.728
Major Support Levels: $38.000, $37.000, and $36.000
Technical Analysis
On the daily timeframe, Hyperliquid against Tether is undergoing a struggle, moving between the simple average ribbon as the stochastic RSI beneath the chart suggests a bearish divergence. Currently, the price of the pair is acting below the $40 level. This signals potential for more downward pressure unless a breakout to the upside is sustained.
To this end, it appears the price is currently below the downward-facing 20-period moving average; any attempt below that level would suggest a move towards $36.00.
This is not a fluke. This is inevitability.
There is only one safe haven in crypto.There is only one asset that turns market-wide liquidations into rocket fuel.
There is only one truth left standing when everything else is on sale: $HYPE.$HYPE is forever. $HYPE is the most… pic.twitter.com/2DbpKAL5yH
— NMTD.HL (@NMTD8) November 18, 2025
Meanwhile, @NMTD8 emphasizes that Hyperliquid appears to be one of the coins in the crypto market that has turned wide-scale liquidations into growth. The analyst believes the token is inevitable and an enduring safe haven; this suggests Hyperliquid is resilient even in the face of currently market situation.
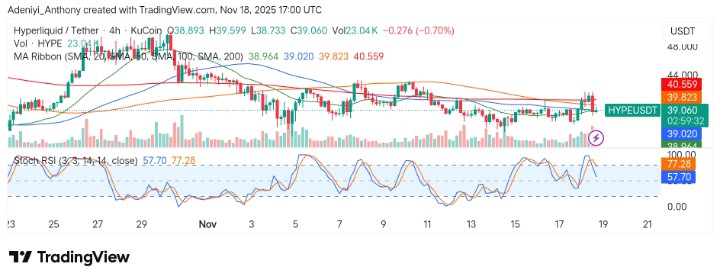
HYPE/USDT Analysis: A Potential Bounce on the Way?
On the 4H chart, HYPE/USDT appears to be managing a bounce off from a short-term support level around $36 as the Stochastic RSI displays that the bulls might be planning an upside move towards $40 momentarily. However, the price action around the moving average ribbon suggests no sudden movement may be happening for now.
To this end, if the price can sustain the current momentum, a move above $40 may trigger a move to upper resistance.
You can purchase crypto coins here. Buy Crypto