Bitcoin (BTC) Price Prediction: BTC/USDT Approaches the $100K Threshold
Estimated Reading Time: 3 minutes
Don’t invest unless you’re prepared to lose all the money you invest. This is a high-risk investment and you are unlikely to be protected if something goes wrong. Take 2 minutes to learn more

Bitcoin (BTC) Price Prediction: February 11
Trading activity in the Bitcoin market has remained below the $100,000 price level for about a week. Moreover, price action has witnessed strong contractions over the past five sessions. However, the market seems to be recovering as green-priced candles with more conspicuous bodies are now appearing.
BTC/USDT Long-Term Trend: Bullish (Daily Chart)
Key Price Levels:
Resistance: $100,000, $105,000, $110,000
Support: $95,000, $90,000, $85,000
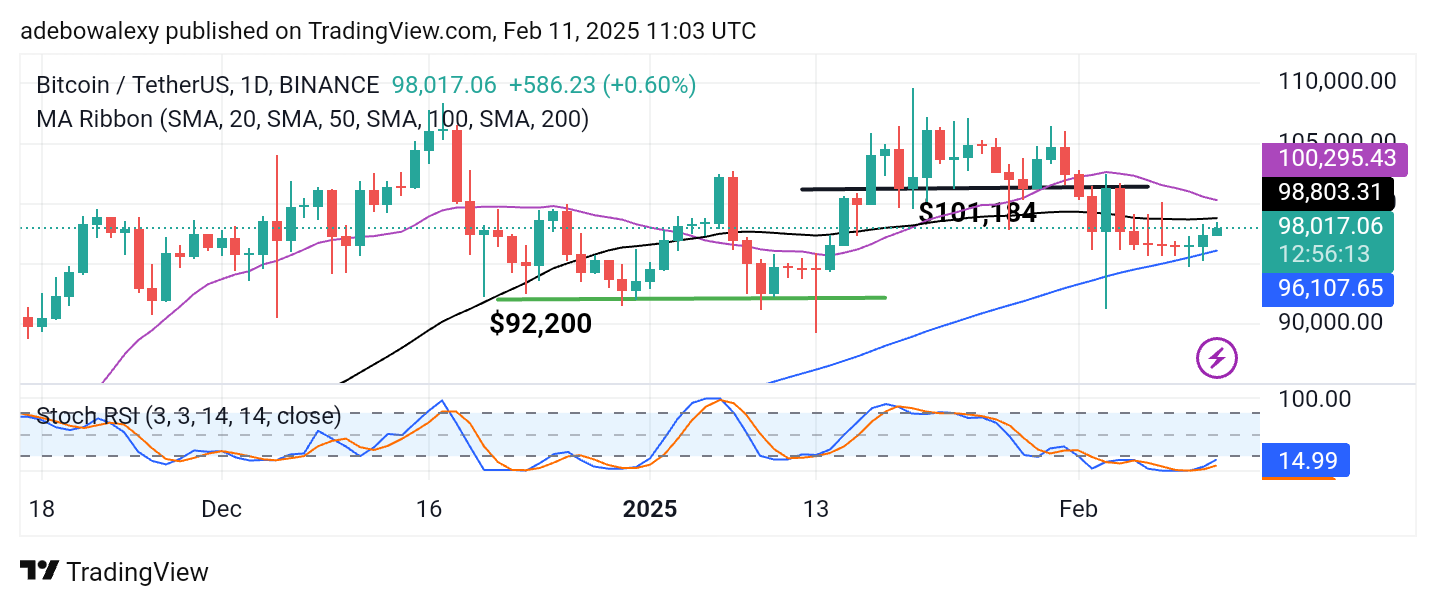
Price action in the Bitcoin daily market is experiencing a continued upside retracement. The last price candle keeps the coin trading above the $98,000 threshold level, albeit by a whisker. Additionally, green price candles have appeared over the past two sessions, indicating progressive movement. Currently, price action is approaching the 50-day Moving Average (MA) line as resistance while rebounding smoothly off the 100-day MA curve. Similarly, the Stochastic Relative Strength Index (RSI) is rising steadily from the oversold region, suggesting that bullish momentum is building.
Bitcoin (BTC) Price Prediction: BTC/USDT Gears Up to Hit $100,000 Once More
Technical indicators in Bitcoin’s daily market still suggest that the recent uptrend is intact. Over the past two sessions, price action has shown steady upward movement. Although the last price candle appears slightly contracted, it retains most of the gains seen in today’s trading activity.
Likewise, the Stochastic RSI indicator lines are still rising from the oversold region, showing no signs of retracement yet on the indicator’s lead line. Technically, this suggests that the general trend remains intact. Therefore, it appears that market participants have set a higher price target, and the trend has the potential to push toward achieving it.
Bitcoin (BTC) Price Prediction: BTC/USDT Sees a Minimal Deflection (4-Hour Chart)
While Bitcoin’s daily chart suggests that the general uptrend is still ongoing, a shorter time frame indicates a minor price deflection. The latest price candle on this chart is red, signaling a slight downward retracement.
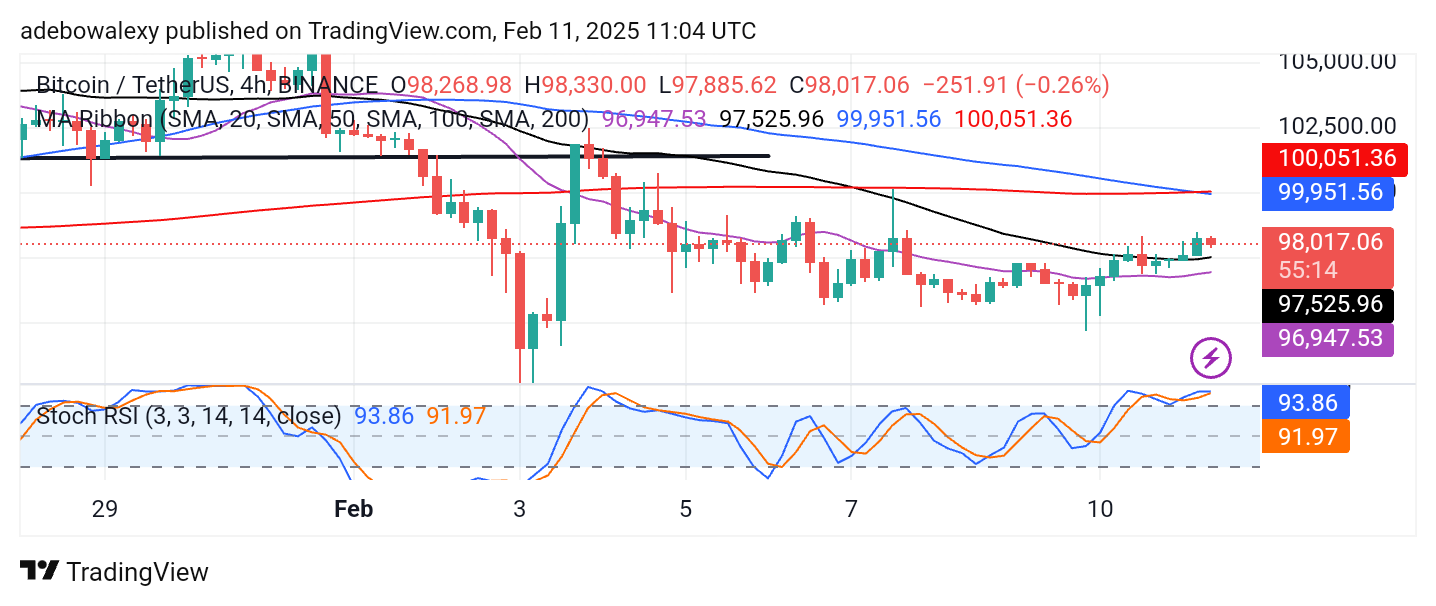
However, price activity remains above the 20- and 50-day MA lines. Additionally, the Stochastic RSI lines maintain an upward trajectory but appear to be converging at their terminal point. Notably, the RSI has not delivered a crossover, suggesting that the observed retracement might be a false alarm—especially since price action remains above two out of four MA lines.
Consequently, traders may hold their positions as prices could push further toward the $100,000 mark shortly.