Bitcoin (BTC) Price Prediction: BTC/USDT Breaks Long-Term Resistance at the $65,000 Mark
Estimated Reading Time: 3 minutes
Don’t invest unless you’re prepared to lose all the money you invest. This is a high-risk investment and you are unlikely to be protected if something goes wrong. Take 2 minutes to learn more

Bitcoin (BTC) Price Prediction: July 17
The Bitcoin market has started retracing its steps back to higher ground. Today’s trading activity so far has seen the token break through the $65,000 price level. This mentioned price level has been a resistance level for weeks. Consequently, the breaking of the resistance shows that bulls are getting significant support from buyers.
BTC/USDT Long-term Trend: Bullish (Daily Chart)
Key Price Levels:
Resistance Levels: $70,000, $75,000, and $80,000
Support Levels: $60,000, $55,000, and $50,000
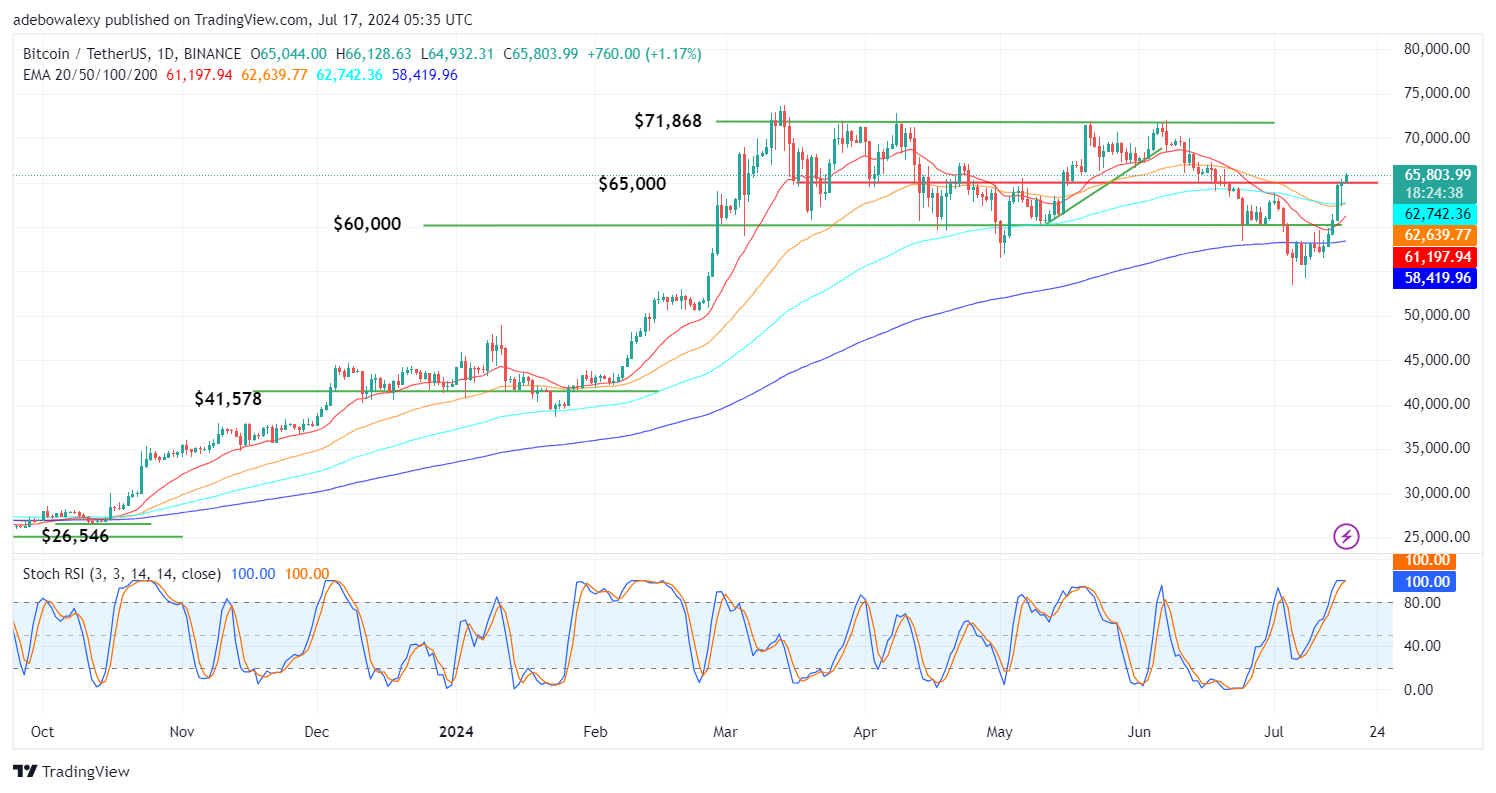
The last price candle on the Bitcoin daily price chart can be seen sitting exactly at the trendline drawn to indicate the $65,000 price level. Although the price candle seems quite small in terms of its body size, it has further moved the market above the Exponential Moving Average (EMA) lines. In addition, the Stochastic Relative Strength Index (SRSI) lines are now in the overbought region. However, it should be noted that the indicator lines are converging but have an upward trajectory.
Bitcoin Price Prediction: BTC/USDT Is Gaining Bullish Traction
The behavior of price movement in the Bitcoin market reveals that more traders are rallying behind bullish bets. Consequently, this has resulted in price activity gaining more upside traction. With the additional gains seen so far in this market, we can see that price activity has progressed further above the EMA lines.
Also, this is compelling the SRSI indicator lines to converge due to significantly reduced volatility in recent sessions, but these indicator lines retain an upward trajectory as a result of today’s recorded gains. Therefore, it is more likely that the market will progress upward.
BTC/USDT Medium-term Trend: Bitcoin Bulls Are Eyeing the $67,000 Mark (4H Chart)
A new session has begun, and in the near term, yet another green price candle has appeared to represent the ongoing session. Consequently, the market is progressing upward, even if it is inch by inch. Trading activities are still happening above all the EMA curves, and the SRSI indicator can be seen trending upwards generally. Interestingly, all the EMA lines can be seen interacting below price activity.
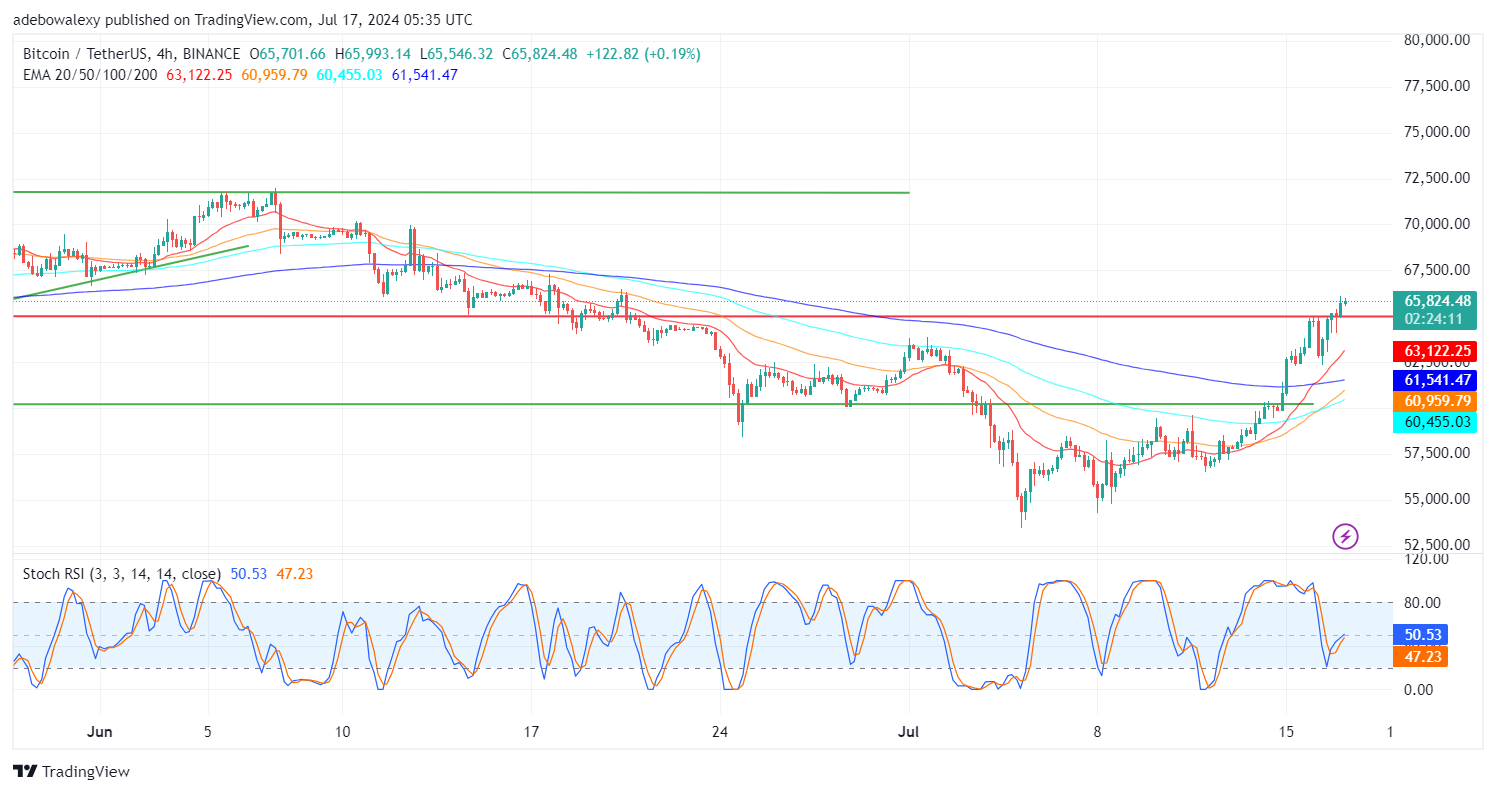
Price volatility has reduced significantly over recent trading sessions, as shown by price activity on the 4-hour chart. Yet, it appears that technical indicators are suggesting that the market may progress further upward. The multiple crossovers on the EMA lines suggest that upside forces may gain momentum towards the $67,000 mark shortly.