Litecoin (LTC) Price Prediction: LTC/USDT Hits a Rejection Near the 50-Day EMA Curve
Estimated Reading Time: 3 minutes
Don’t invest unless you’re prepared to lose all the money you invest. This is a high-risk investment and you are unlikely to be protected if something goes wrong. Take 2 minutes to learn more

Litecoin (LTC) Price Prediction: July 15
The Litecoin market has seen some meaningful upside corrections. This seems to have occurred in tandem with the bullish momentum gaining in the BTC market. So far, the market has witnessed considerable downward contractions, but it remains above some important technical indicator landmarks.
LTC/USDT Long-term Trend: Bullish (Daily Chart)
Key Price Levels:
Resistance Levels: $80.00, $90.00, and $100.00
Support Levels: $70.00, $60.00, and $50.00
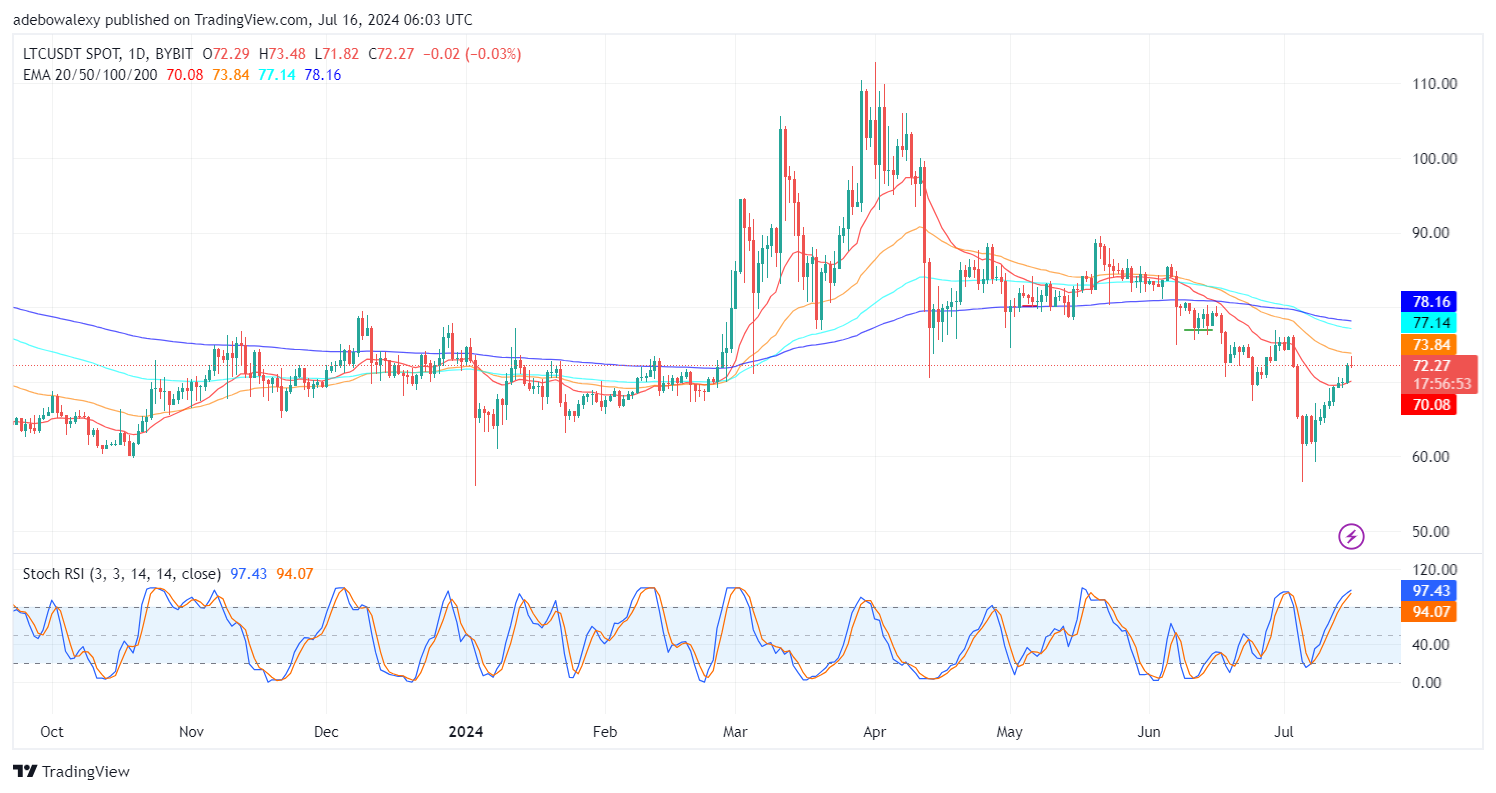
Tailwinds in the Litecoin daily market have caused prices to retrace to higher levels. In the previous session, price action seemed to have obtained support just above the $70 mark. However, today’s session seems to have faced some rejection, causing prices to contract downward, as revealed by the last price candle on this chart. Be that as it may, trading activities continue above the 20-day Exponential Moving Average (EMA) curve. Likewise, the Stochastic Relative Strength Index (SRSI) lines are still in the overbought region of the indicator at the 97 and 94 levels (leading to lagging lines).
Litecoin Price Prediction: LTC/USDT Market Faces Bearish Contractions Near $73 Level
Although trading indicators are still positively biased, some signs point to a decline in bullish momentum. This can also be seen as the SRSI lines appear to have converged a bit further following the rejection in the ongoing session.
Additionally, the appearance of the last price candle on the chart reveals that headwinds are acting on price movements. However, the crypto continues to trade at a considerable distance above the 20-day EMA line. This may hint that upside forces may resume pushing the market further upward.
LTC/USDT Medium-term Trend: Litecoin Stands Above the 200-Day EMA (4H Chart)
Price activity in the Litecoin 4-hour market has risen past all the EMA curves. Also, the downward contraction noticed earlier on the daily chart can be seen in this market time frame. However, the downward rejection still stands above all the EMA lines and precisely atop the 200-day EMA curve. The last price candle has revealed that the market has erased all the previously recorded gains.
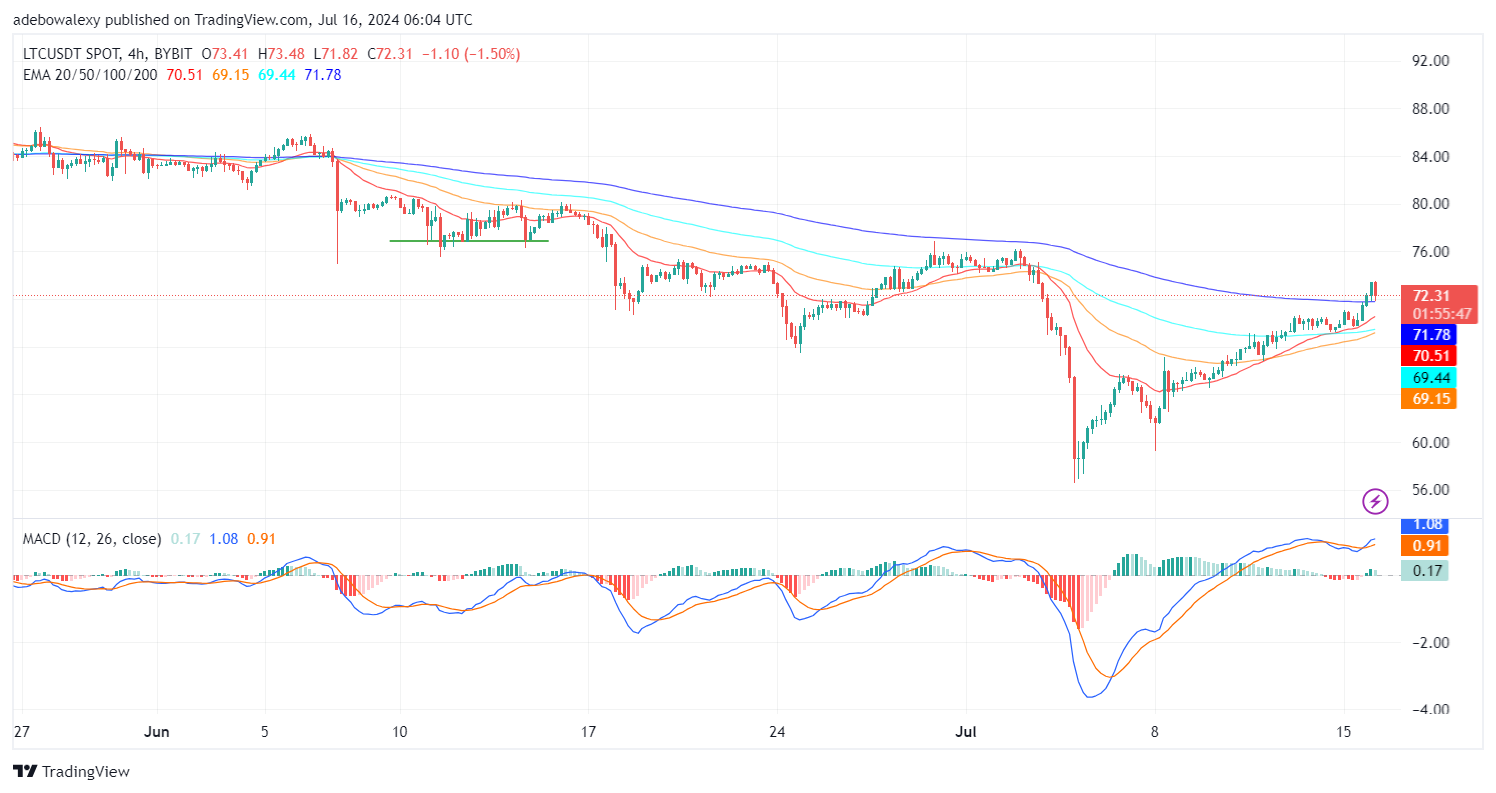
Moreover, the Moving Average Convergence Divergence (MACD) lines can be seen above the equilibrium level. The last bar of this indicator is now pale green, reflecting the downward correction in the market. While traders can still hope that the market may hit higher price levels, we should expect that the market may reverse towards technical support at $70.