Bitcoin (BTC) Price Prediction: BTC/USDT Continues Ranging
Estimated Reading Time: 3 minutes
Don’t invest unless you’re prepared to lose all the money you invest. This is a high-risk investment and you are unlikely to be protected if something goes wrong. Take 2 minutes to learn more

Bitcoin (BTC) Price Prediction: July 3
Going by the historical price performance of Bitcoin, it can be seen that the market hasn’t fallen too far from its previous height in the last bull market. The king traded at the highest high of $69,000 (2021) but now ranges between a narrow price range of $60,000 and $64,000. Nevertheless, considering historical price movements, this may seem like a good entry point for traders.
BTC/USDT Long-term Trend: Bullish (Daily Chart)
Key Price Levels:
Resistance Levels: $65,000, $70,000, and $75,000
Support Levels: $60,000, $55,000, and $50,000
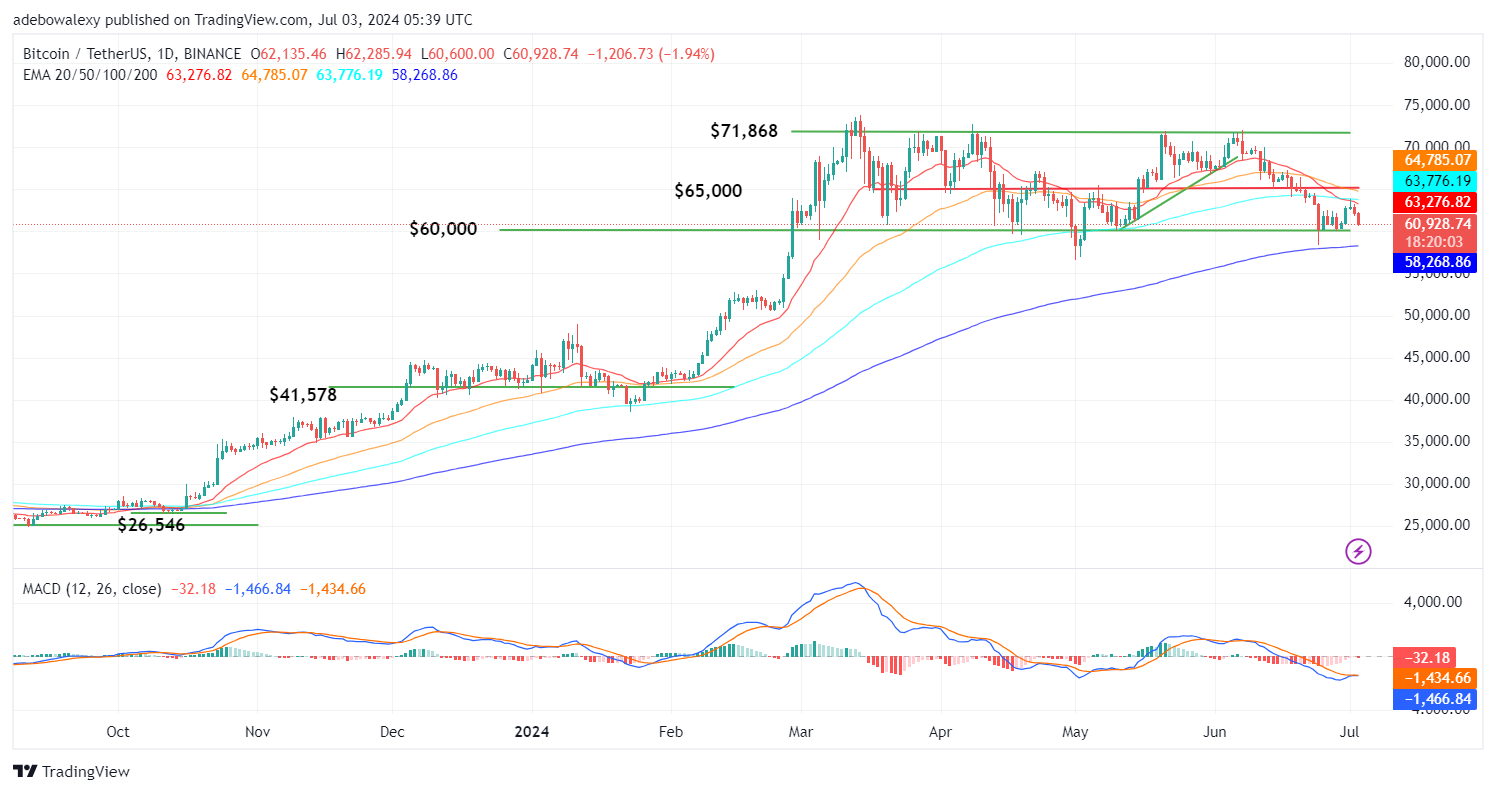
The ongoing session in the Bitcoin daily market has produced a significant price decline towards a technical support at $60,000. The market has descended below the 20, 50, and 100-day Exponential Moving Averages (EMAs). Furthermore, we can see that the 20- and 100-day EMAs have performed a bearish crossover above price action, supplying downward pressure on price movement. Meanwhile, the Moving Average Convergence Divergence (MACD) indicator lines appear to have delivered a bearish impetus to the market, as a red bar has shown up below its equilibrium level.
Bitcoin Price Prediction: BTC/USDT Heads Toward Technical Support
Going by indications in Bitcoin’s daily market, it is clear that price activity is headed toward defensive support at the $60,000 mark. The bearish momentum in the market seems healthy enough, going by the appearance of the last price candle on the analyzed price chart.
It could be seen earlier that the lines of the MACD portrayed indecision as they trended sideways. However, the indicator lines have eventually delivered stronger bearish momentum via the appearance of a red price candle below the equilibrium level. At this point, the market is headed downward and may even hit lower levels than the said technical support.
BTC/USDT Medium-term Trend: Bitcoin Stays on a Bearish Path (4H Chart)
The previously concluded session on the 4-hour Bitcoin market has produced a significant downward correction. Furthermore, another session has commenced with downward forces still in control. Meanwhile, trading activity in this market timeframe is now totally below all the EMA lines. The 20- and 50-day EMA lines can be seen crossing over the above price action. The MACD can be seen plunging towards the equilibrium level, with its bars appearing solid red.
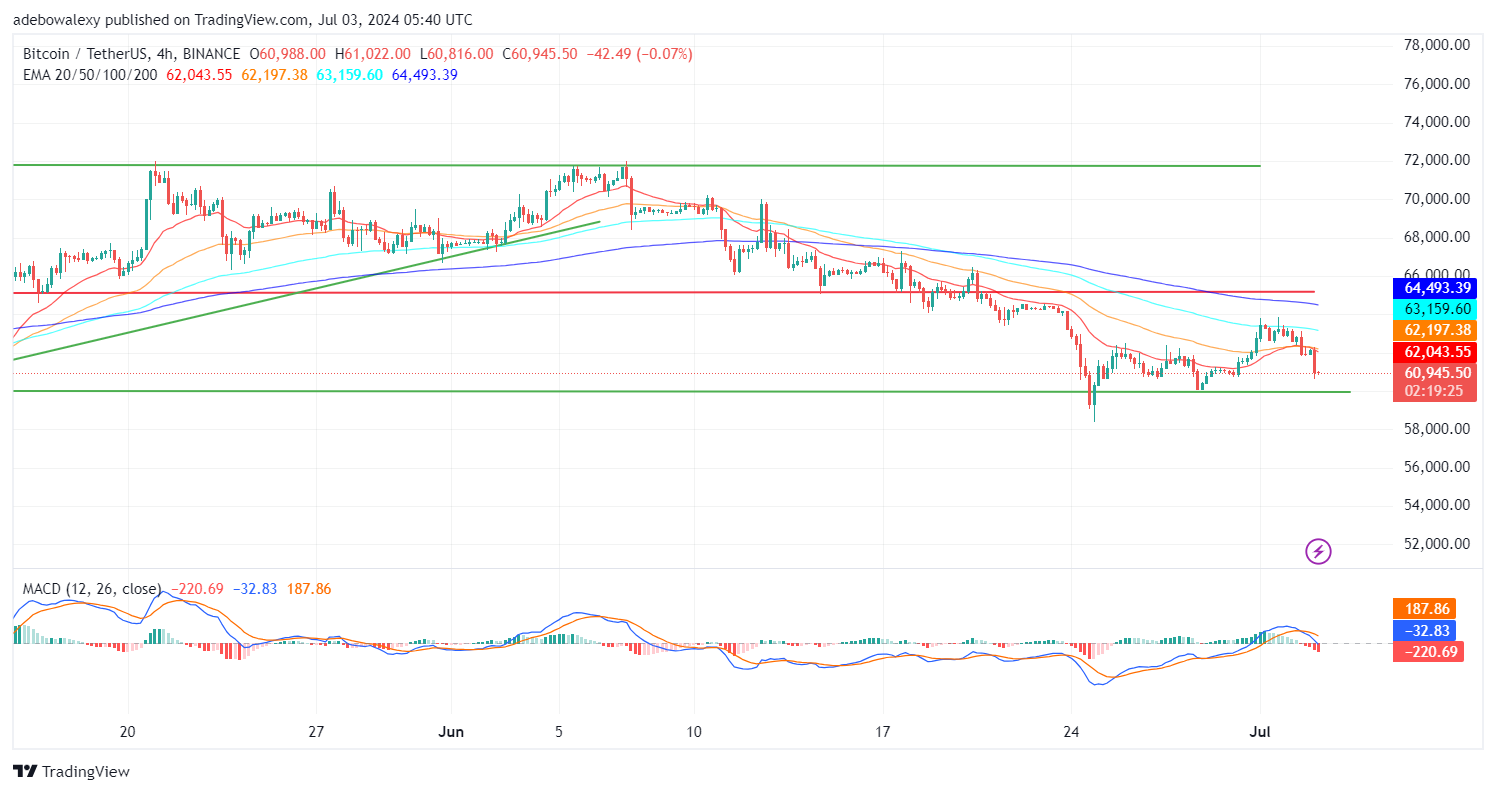
Going by available indications in the market, it is visible that price sellers are in control of the market. What’s more, their activity is delivering more downward pressure on price movement. The MACD indicator lines hint that downward forces are maintaining a firm grip on price activity and may cause the market to retreat below the $60,000 and $59,000 price levels.