Bitcoin (BTC/USD) Business Activity Hovers Closer at $52,500
Estimated Reading Time: 3 minutes
Don’t invest unless you’re prepared to lose all the money you invest. This is a high-risk investment and you are unlikely to be protected if something goes wrong. Take 2 minutes to learn more
Bitcoin Price Prediction – September 5
There has been a sign of an improvement in the BTC/USD valuation as the crypto-economic business activity hovers closer to the level at $52,500. The crypto’s percentage rate of trading stands at about 0.08 to trade around the level of $50,404. The value earlier mentioned appears to be the main resistance line against the pathway of the market to seeing more upsides presently.
BTC/USD Market
Key Levels:
Resistance levels: $52,500, $55,000, $57,500,
Support levels: $45,000, $42,500, $40,000
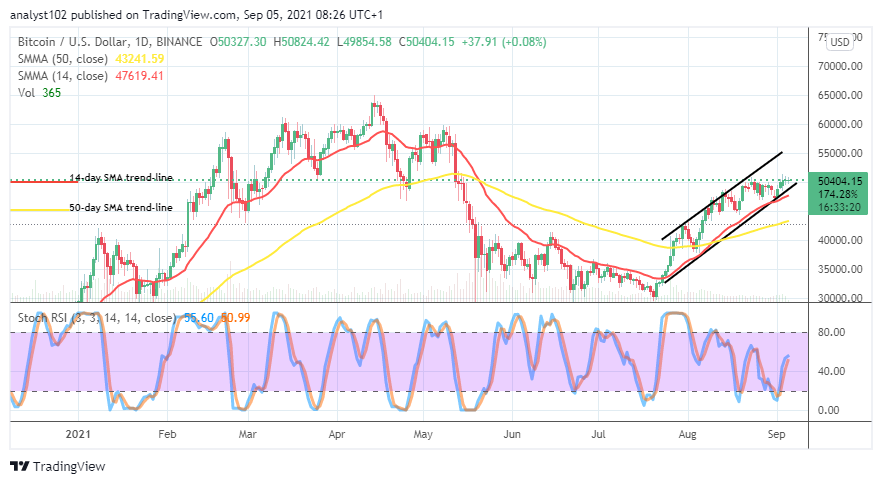
BTC/USD – Daily Chart
The BTC/USD daily chart shows that crypto business activity hovers closer to the line of $52,500 during the September 2nd trading period. The bullish channel trend-lines are yet relevantly showing the path direction that the BTC/USD market maintains. The 14-day SMA indicator trends alongside the lower bullish trend-line over the 50-day SMA indicator. The Stochastic Oscillators have briefly moved past the range of 40 with the lines closed. That indicates that the market may soon witness a pause around the higher trading zone.
Will there be a push further to the north side as the business activity hovers closer to the level of $52,500?
At this point, an abrupt spike is most needed to feature against the against the line of $52,500 to have a clearer opinion that the crypto economy may soon enter higher trading zones as the business activity hovers closer to the point. All in all, the market bulls needed to some amount of active motions to the downside around the lower bullish channel trend-line and the smaller SMA trend-line to gain a support for the aftermath upswings.
On the downside, it relatively indicated that the BTC/USD market bears have the potency to regain the momentum around $52,500 while false price action tends to appear against the point. The Stochastic Oscillators, attempting to close the lines a bit above the range of 40, suggest a high possibility of seeing the market returning to a downward force in the near time. Points between $52,500 and $55,000 could be the best zones that sell-off situation may afterward take reliable shape.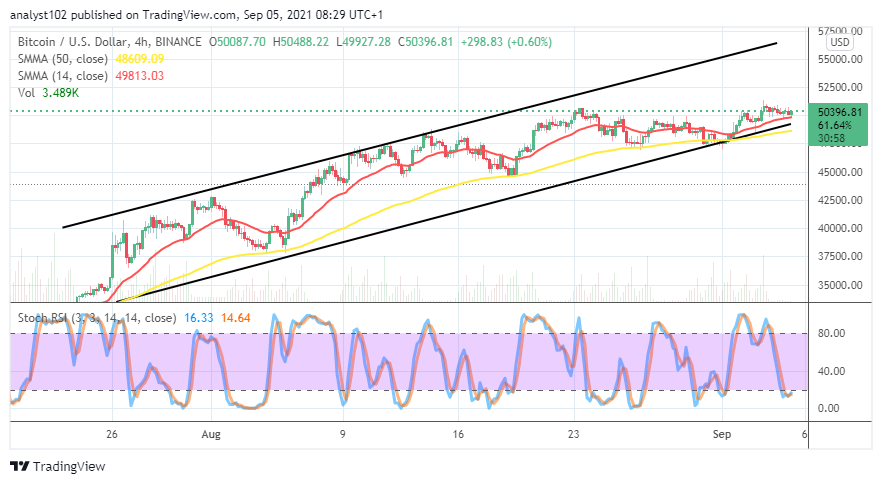
BTC/USD 4-hour Chart
The bullish channel trend lines are kept intact on the BTC/USD 4-hour chart as the crypto business activity hovers above the trend lines of the SMAs. The bullish channel trend lines are kept intact on the BTC/USD 4-hour chart as the crypto business activity hovers above the trend lines of the SMAs. There is a space separating the SMAs. The 14-day SMA trend-line is above the 50-day SMA trend-line. The Stochastic Oscillators are in the oversold region with closed lines, making an effort to cross northbound against the range of 20. The present trading outlook of the crypto market seems to have something in common, around $50,000 on the medium-term chart. That suggests that the main price action would have to span from around that value line.
Note: Cryptosignals.org is not a financial advisor. Do your research before investing your funds in any financial asset or presented product or event. We are not responsible for your investing results.
You can purchase crypto coins here. Buy Tokens