Bitcoin (BTC/USD) Keeps Trading Underneath the $60,000 Resistance Point
Estimated Reading Time: 3 minutes
Don’t invest unless you’re prepared to lose all the money you invest. This is a high-risk investment and you are unlikely to be protected if something goes wrong. Take 2 minutes to learn more
Bitcoin Price Prediction – May 5
There has been a continual positive slight response to declining pressure imposed on the flagship crypto by the US Dollar down the line underneath the resistance level of $60,000. The crypto’s value as of writing trades around a low level of $55,000.
BTC/USD Market
Key Levels:
Resistance levels: $60,000, $65,000, $70,000
Support levels: $50,000, $45,000, $40,000
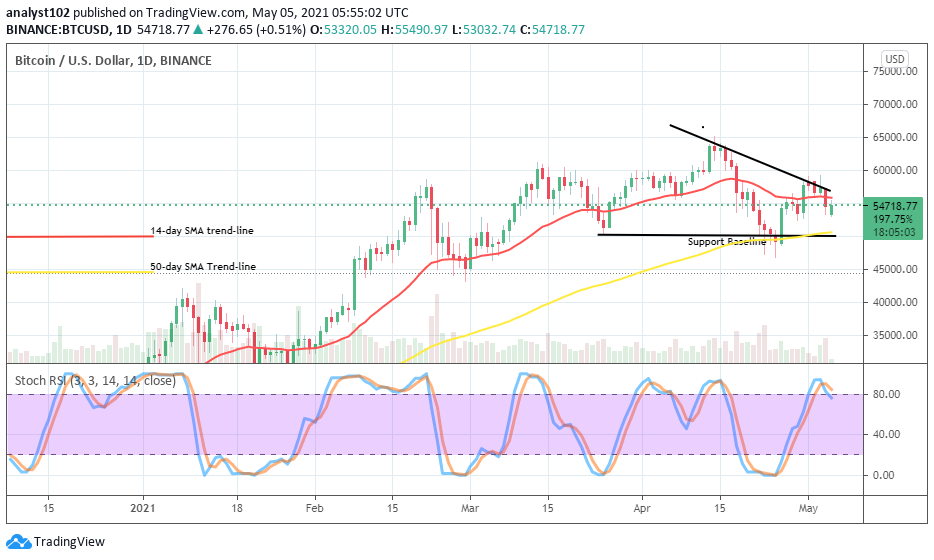
BTC/USD – Daily Chart
The BTC/USD daily trading chart shows a bearish trend-line drew to suggest a key resistance point in between the $55,000 and $60,000 as an area that the market is being placed under a fall-off pressure. The 14-day SMA trend-line has been seeing moving closely along the emergence of variant candlesticks representing the pace market’s movements so far. The 50-day SMA indicator is located at the $50,000 support level with a line drew to affirm the value as the critical support baseline. The Stochastic Oscillators have crossed the hairs in the overbought region nearing the range 80. But, they now seemingly attempt crossing it back to the north. That signals that an amount of upward move is in the offing.
Will there now soon be a breakout of the BTC/USD resistance point at $60,000?
The BTC/USD market valuation’s journey to the north appears not easily achievable in a near trading session. The kind of momentum being put up by bulls is so much weak at a mid-point of $55,000 and $60,000 levels. A further forceful loss of momentum around the former point mentioned may potentially cause a re-visit of a low around the critical support baseline market at the $50,000 line.
The mid-point of $55,000 and $60,000 levels are now crucial in the determination of the area that bears need to be watchful. However, a breakout of the point to the above level of the $60,000 resistance line will most likely put off the bears’ stance in the market in no time. But, a re-test of the immediate resistance value may cause a continual holding down of the crypto’s price below it for some more sessions.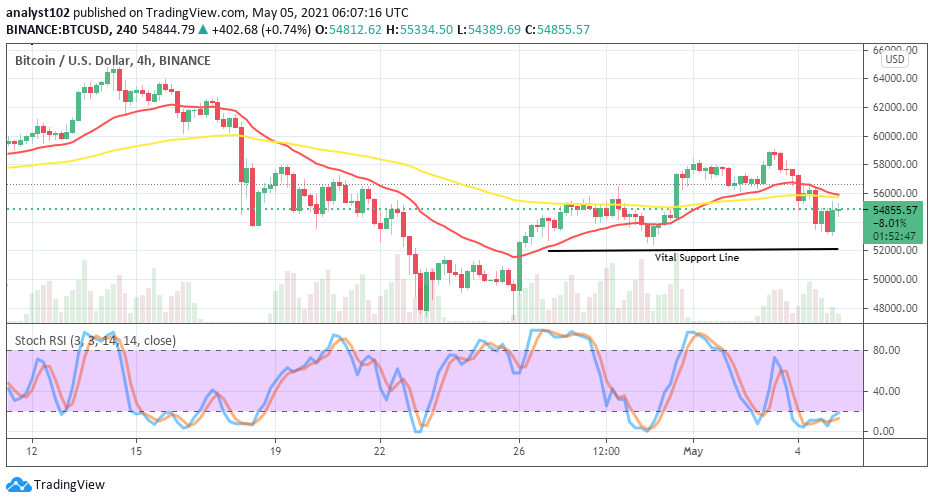
BTC/USD 4-hour Chart
It now appears on the medium-term chart that the market valuation of BTC has been slightly overwhelmed by the US Dollar. Some candlesticks have formed from the top briefly down below the SMAs to attest to that. The 14-day SMA trend-line has slightly bent southward from the above towards the 50-day SMA indicator. A vital support line is drawn at the level of $52,000 to suggest the most likely lower point the crypto’s may drop at a later time. The Stochastic Oscillators are dipped in the oversold region trying to point to the north. That signals the possibility that the crypto tends to regain its lost energy in the near time.
Note: cryptosignals.org is not a financial advisor. Do your research before investing your funds in any financial asset or presented product or event. We are not responsible for your investing results.