Bitcoin (BTC/USD) Price Trades in Bearish Settings
Estimated Reading Time: 3 minutes
Don’t invest unless you’re prepared to lose all the money you invest. This is a high-risk investment and you are unlikely to be protected if something goes wrong. Take 2 minutes to learn more
Bitcoin Price Prediction – January 19
It is currently apparent that the BTC/USD price valuation trades in bearish settings since the crypto-economic operations commence this year. As of writing, the market has a minute percentage rate of about 0.27negatives. Price trades between a higher point of about $42,537 and a lower value line of about $41,182.
BTC/USD Market
Key Levels:
Resistance levels: $45,000, $47,500, $50,000
Support levels: $40,000, $37,500, $35,000
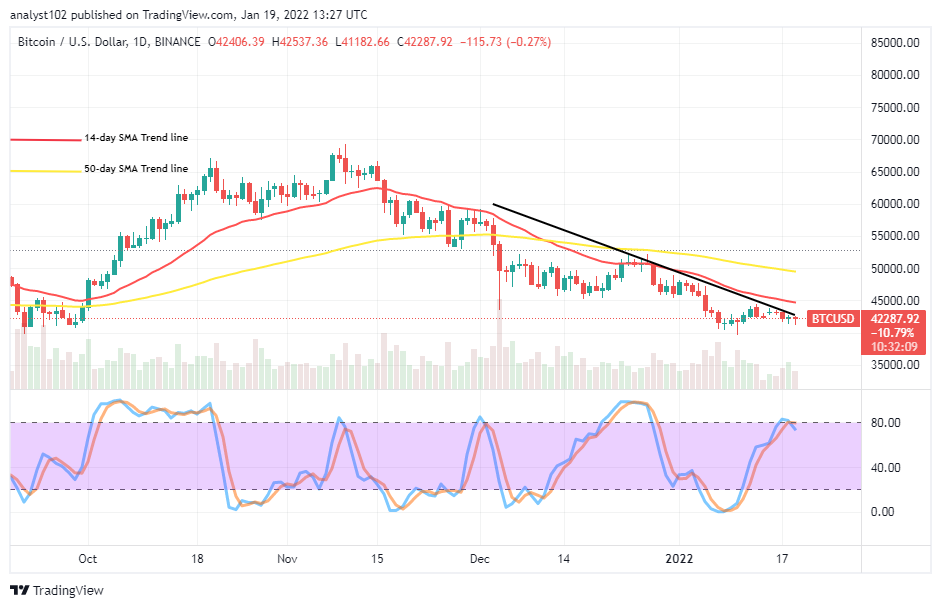
BTC/USD – Daily Chart
The BTC/USD daily chart showcases the crypto-economic price trades in bearish settings as the bearish trend line drew southward, slightly protruding past the smaller SMA to place on the current forming candlestick. The 14-day SMA indicator is underneath the 50-day SMA indicator with a space between them. The Stochastic Oscillators are at the range of 80, trying to cross their lines southbound. Indications are backing so much downwards than upwards in the near time.
Are there still indications that the BTC/USD market will surge past the $45,000 resistance level as the crypto’s price trades in bearish settings?
There has been no significant gathering of upward momentum to warrant the BTC/USD market operations breaking the $45,000 resistance for sustainability as the crypto-economic price trades in bearish settings that have outlined southward past the value line. Based on that assumption, long-position takers currently needed to exercise some degrees of patience in exerting buying orders. It would be technically ideal that they stay alert to observe when there’ll be a rebounding motion stemming from a lower trading spot before deciding to launch an order.
On the downside of the technical analysis, it appears that vital resistance trading lines have built up around the $45,000 level. And, some pull-ups that will be emerging toward the value line are likely bound to get visibly resisted in the long run to allow decent sell order positioning afterward. A sustainable price trading over the value line mentioned earlier may lead to getting a row of range-bound trading between it and the higher resistance point at $50,000. 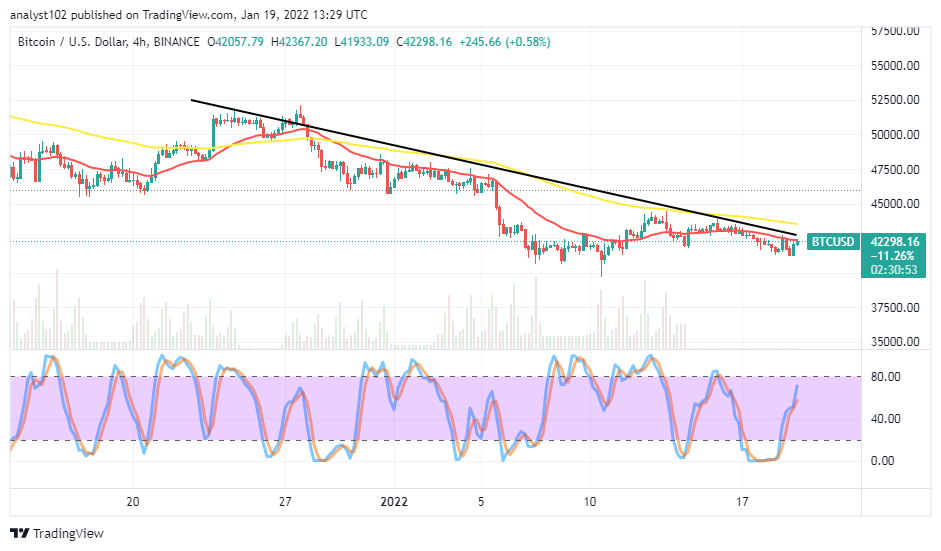
BTC/USD 4-hour Chart
The BTC/USD 4-hour chart shows the crypto-economic price trades in bearish settings as all the indicators bend southward, aligning with the formations of candlesticks featuring to the downside. The 50-day SMA trend line is above the 14-day SMA trend line. Two 4-hour bullish candlesticks have formed presently to denote that price has relatively gained an upward momentum. The Stochastic Oscillators are moving northbound closely to the range of 80. That signifies that a rallying motion is ongoing. The movement may hit a resistance soon to pave the way for a sell order closely beneath or around the $45,000.
Note: Cryptosignals.org is not a financial advisor. Do your research before investing your funds in any financial asset or presented product or event. We are not responsible for your investing results.
You can purchase crypto coins here. Buy Tokens