Bitcoin (BTC/USD) Market Awaits Bullish Break After Retracement Phase
Estimated Reading Time: 3 minutes
Don’t invest unless you’re prepared to lose all the money you invest. This is a high-risk investment and you are unlikely to be protected if something goes wrong. Take 2 minutes to learn more

Bitcoin Price Prediction – November 7
BTCUSD market awaits a bullish break after the retracement phase. A bearish retracement is impending as BTC/USD invalidated the all-time high, diving into an overbought region.
The BTCUSD chart features a Stochastic RSI indicator that suggests overbought conditions, with current readings around 91. This high value indicates potential short-term downward pressure as traders may seek to lock in gains. Additionally, the 9-day Simple Moving Average (SMA), currently around $71400, shows a strong bullish trend, supporting the overall upward momentum of BTCUSD. However, a brief retraction toward the SMA level could provide a healthy reset before further gains.
BTC/USD Market Key Levels:
Resistance Levels: $70000, $73840, $80000
Support Levels: $65050, $57480, $52530
BTC/USD – Daily Chart
The BTCUSD daily chart shows that the market is set for a bearish retracement.
Price action reveals that BTCUSD recently broke through a significant resistance level around $73840 and is now testing the area above this breakout. A demand zone between $66550 and $70930 is likely to act as strong support during the anticipated retracement.
The ascending trendline from September aligns with this support zone, suggesting a higher probability of a bounce if the price retraces to this region. A pullback toward this area would set the stage for renewed bullish activity.
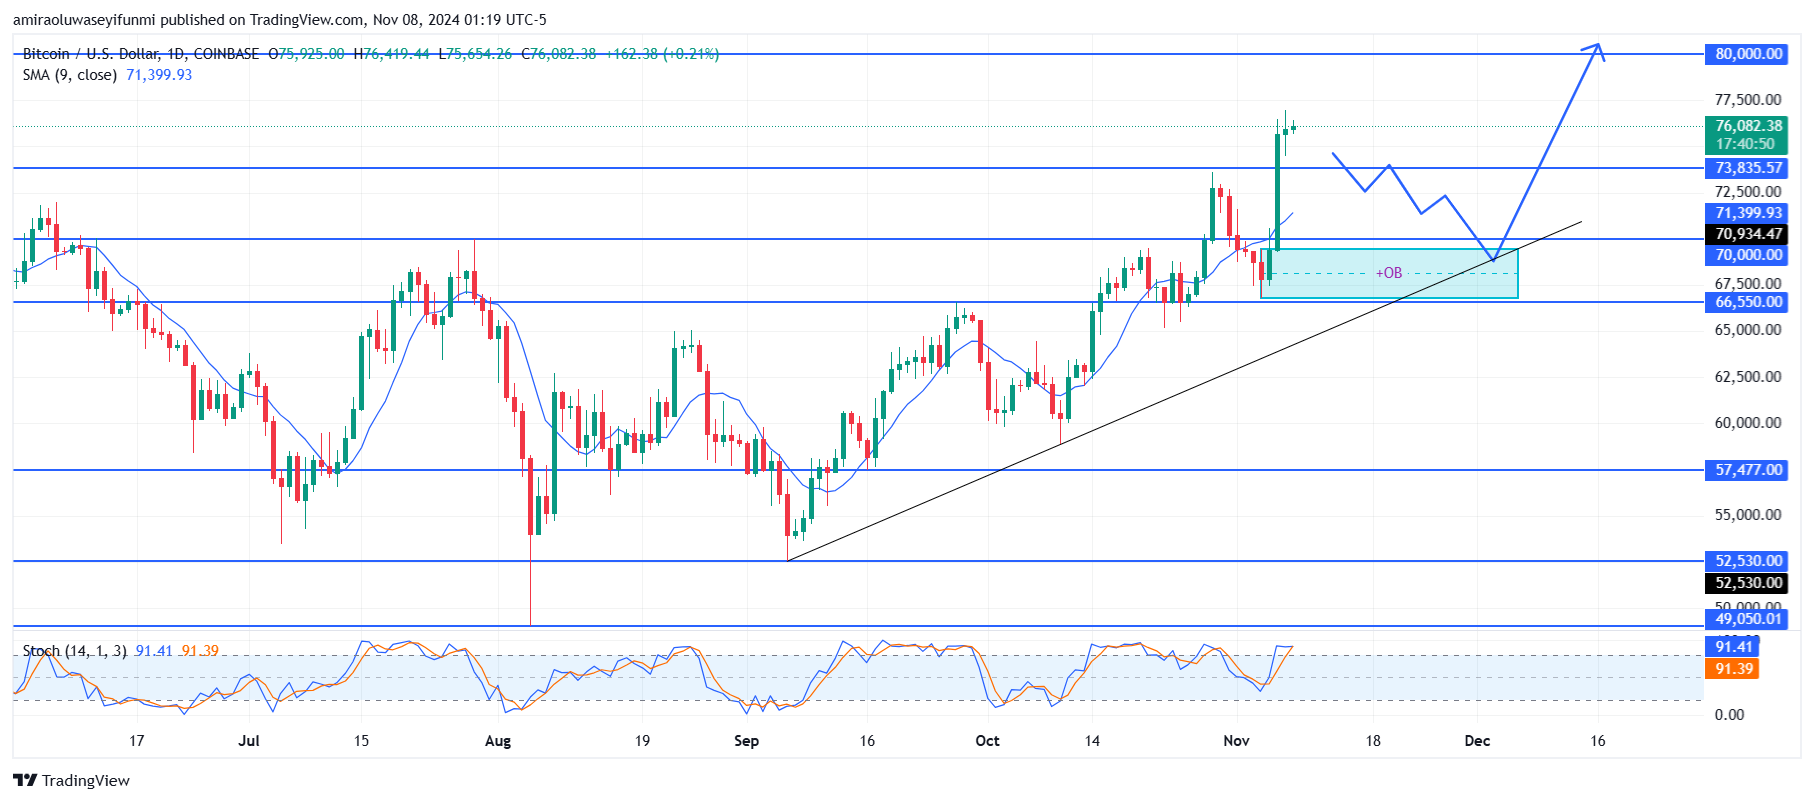
What is the likely projection of BTCUSD?
Following the completion of the retracement, BTCUSD is expected to resume its upward trajectory with a potential target of $80000. This projection is supported by the bullish trendline and prior resistance levels now acting as support.
A successful bounce from the $70000 area would confirm the continuation of the uptrend, allowing BTCUSD to reach new highs, with $80000 as the primary target for this bullish wave.

BTC/USD – Four-Hour Chart
The BTCUSD four-hour chart shows signs of bearish movement, with the Stochastic RSI overbought at approximately 87, signaling potential downward pressure. Price is facing resistance at $76,035 and appears poised for a retracement.
A drop toward the support zone around $70000–$66550 is likely, as the price consolidates below the $73840 resistance. The 9-period SMA at $75670 also aligns with this bearish outlook, suggesting further downside potential in the short term.
Bitcoin (BTC) Current Statistics
The current price: $76070
Market Capitalization $1,500,000,000,000
Trading Volume: $59,410,000,000
You can purchase Bitcoin here. Buy BTC