Bitcoin (BTC/USD) Market Continues to Feature in Ranges
Estimated Reading Time: 3 minutes
Don’t invest unless you’re prepared to lose all the money you invest. This is a high-risk investment and you are unlikely to be protected if something goes wrong. Take 2 minutes to learn more

Free Crypto Signals Channel
Bitcoin Price Prediction – June 5
The BTC/USD market operation continues to feature in ranges as the two market movers seem to have chosen to trade around definite upper and lower lines several days back. Price is currently trading around $29,698 at a minimal negative percentage rate of 0.66.
BTC/USD Market
Key Levels
Resistance levels: $32,500, $35,000, $37,500
Support levels: $27,500, $25,000, $22,500
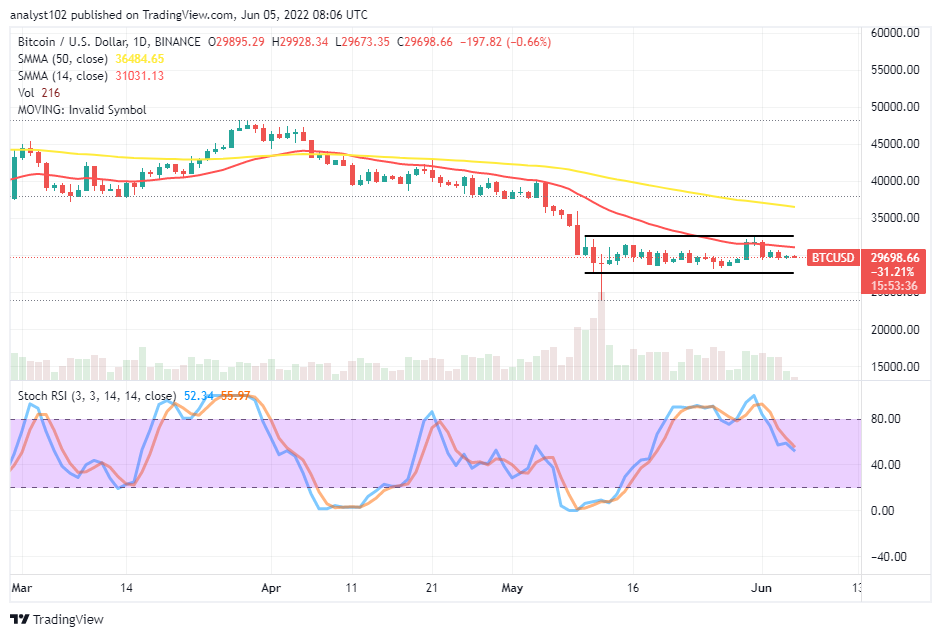
BTC/USD – Daily Chart
The BTC/USD daily chart showcases the crypto-economic market continues to feature in ranges. Over time, there have been some attempts made in futility to break northward past the trend line of the smaller SMA to give the upward force a brighter of making a comeback. The 14-day SMA trading indicator is underneath the 50-day SMA indicator. The Stochastic Oscillators have slantingly bent southbound from the overbought region against some range points closely above the 40. That portends a selling force is somewhat ongoing.
When will the BTC/USD market’s ranging operations end?
A sudden fearful breakout at the upper range trading spot or the lower range is required to push out the range operations. In the meantime, a downward-trending force may prevail over northward pushes within the range-bound trading zones. As usual, long-position takers have to be on the lookout for when there’ll be a rebound at a lower-range trading spot if there will be any around the $27,500 support level before considering launching a buying order.
On the downside of the technical analysis, the BTC/USD market may still go dumping more out of the lower range spot to cause a panic sell-off situation. However, buying and selling activities can prolong featuring smaller candlesticks to the downside while price tends not to carry high volatility. It is not likely that the price will sustain rallying against the upper range spot in the trading days ahead. A lower-time frame like a 1-hour chart will allow traders to detect a timely entry.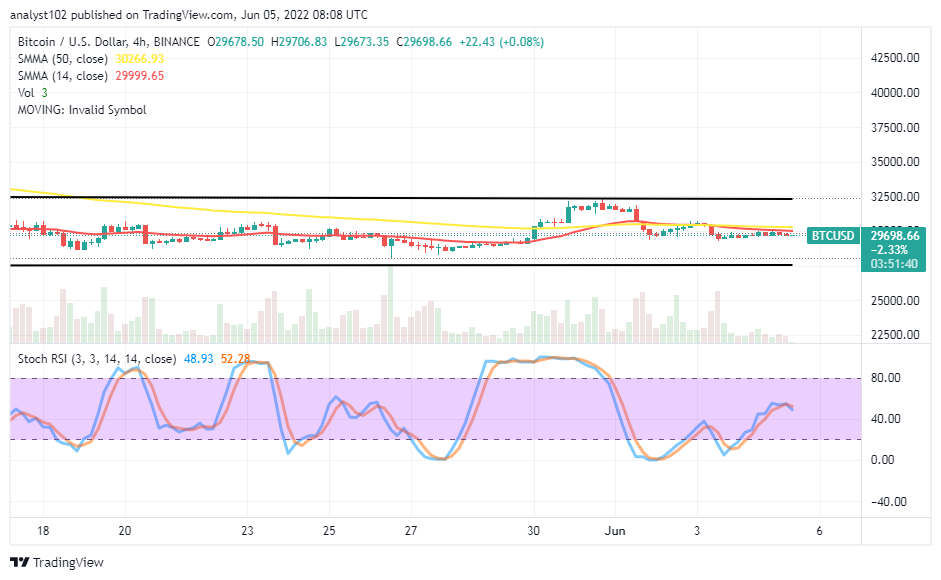
BTC/USD 4-hour Chart
The BTC/USD medium-term chart shows the crypto-economic market continues to feature in ranges. The upper range line is around the $32,500 resistance level, and the lower range line is around the $27,500 support level. The 50-day SMA indicator has conjoined with the 14-day SMA indicator within the range-bound zones. The Stochastic Oscillators are between the 80 and 40 range points. The present trading situation suggests downward forces may still dominate the market pace in the subsequent operations.
Note: Cryptosignals.org is not a financial advisor. Do your research before investing your funds in any financial asset or presented product or event. We are not responsible for your investing results.
“Lucky is up more than 50% today but still more than 430% from All Time Highs!
The opportunity to bank BIG is now!
You can purchase Lucky Block here. Buy LBlock