Bitcoin (BTC/USD) Market Encounters a Resistance Above $20,000
Estimated Reading Time: 3 minutes
Don’t invest unless you’re prepared to lose all the money you invest. This is a high-risk investment and you are unlikely to be protected if something goes wrong. Take 2 minutes to learn more


Free Crypto Signals Channel
Bitcoin Price Prediction – July 10
The BTC/USD market encounters resistance closely above the psychological $20,000 line. The trading situation shows price has reached a high of $21,609 and a low of $21,146 at a negative percentage rate of 1.27.
BTC/USD Market
Key Levels
Resistance levels: $22,500, $25,000, $27,500
Support levels: $20,000, $17,500, $15,500
BTC/USD – Daily Chart
The BTC/USD daily chart reveals the crypto-economic market encounters a resistance closely above the logical $20,000 support level. The 14-day SMA trend line is underneath the 50-day SMA trend line. The horizontal line drew at the value-line near below the resistance point indicated by the smaller SMA at $21,895. The Stochastic Oscillators are in the overbought region with the lines conjoined in an attempt to cross back southbound within.
Will the BTC/USD price swing northward back against the 14-day SMA soon?
The swinging back of the BTC/USD price against the resistance point indicated appears dicey at this moment, as the crypto market encounters resistance around the 14-day SMA trend line. Bulls in the pairing trade operations are to exercise extreme caution in exerting new buying orders. An aggressive breach of the $20,000 level will put the price back into a lower-trading spot of around $17,500 so that long-position takers will have to get repositioned afterward to make a come-back.
On the downside of the technical analysis, selling pressures have been garnering around the 14-day SMA trend line. A smaller bearish candlestick is in the making around the trading SMA coupling with a short cross of the Stochastic Oscillators to the southbound within the overbought region. The $21,895 serves as the key resistance point to the declining motion. The overall verdict remains that bears gain the market advantage.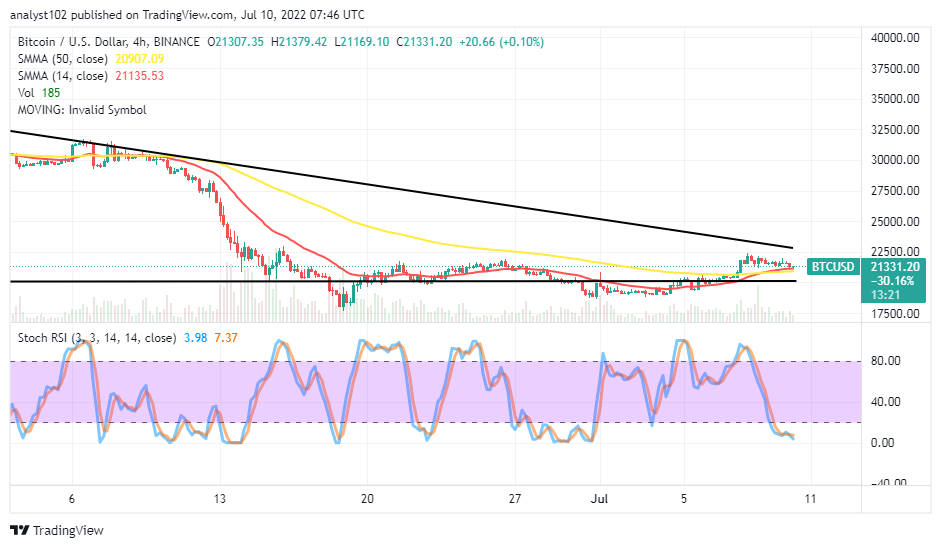
BTC/USD 4-hour Chart
The BTC/USD medium-term chart showcases the crypto-economic market encounters resistance around the $22,500 level. The 14-day SMA indicator has moved northward to conjoin with the 50-day SMA indicator closely over the horizontal line drawn. The Stochastic Oscillators are in the oversold region. That portends the market may face an elongation of range-trading conditions around the space of both the bearish trend line and the horizontal line drawn for some time. Traders needed to exercise more patience.
Note: Cryptosignals.org is not a financial advisor. Do your research before investing your funds in any financial asset or presented product or event. We are not responsible for your investing results.
“Lucky is up more than 50% today but still more than 430% from All Time Highs!
The opportunity to bank BIG is now!
You can purchase Lucky Block here. Buy LBlock