Bitcoin (BTC/USD) Market Experiences a Pump-Up
Estimated Reading Time: 3 minutes
Don’t invest unless you’re prepared to lose all the money you invest. This is a high-risk investment and you are unlikely to be protected if something goes wrong. Take 2 minutes to learn more
Bitcoin Price Prediction – October 10
The BTC/USD market currently experiences a pump-up in its price movements. The crypto economy’s percentage rate of trading against the US dollar is at about 1.19 as price trades around the line of $55,343.
BTC/USD Market
Key Levels:
Resistance levels: $55,750, $60,000, $62,500
Support levels: $52,500, $50,000, $47,500
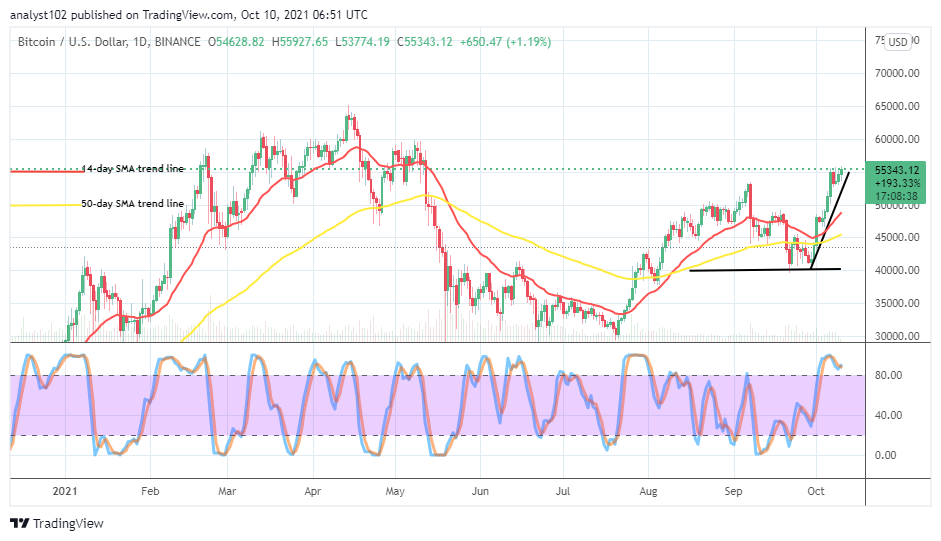
BTC/USD – Daily Chart
The daily chart showing the trading activities between Bitcoin and the US Dollar reveals that the crypto market experiences a pump-up in its price movements. On October 6, a bullish candlestick emerged to touch the resistance at the $55,000 line. And that gave rise to another trading situation settings as to whether the market has reached a peak point to reverse or a pause that could in no time turn into further upward movements. The 14-day SMA has curved to the north side over the 50-day SMA as the bullish trend line drew to touch a psychological barrier line to the upside. The Stochastic Oscillators are in the overbought region with the lines conjoined, showing a sign of getting more ups.
Will there soon be a change in the BTC/USD trading activities as the market experiences a pump-up?
It may take a while before a tangible change in the BTC/USD current trading situation as the market experiences a pump-up in its price movements. Indications still strongly back the condition as there will be more possible upsides in the forthcoming trading activities than downsides. In the meantime, buy entries are easily visible on lower time frames or charts as there may as well be a low-active price reaction in the process to the moon direction.
About the bearish trend return, this crypto-economic market may now have to witness series of price resistances around $55,000 to create an intimating condition against further uprisings. A bearish engulfing candlestick will have to emerge against some of the variant bullish candlesticks that have formed in the past so that bears will get decent entries.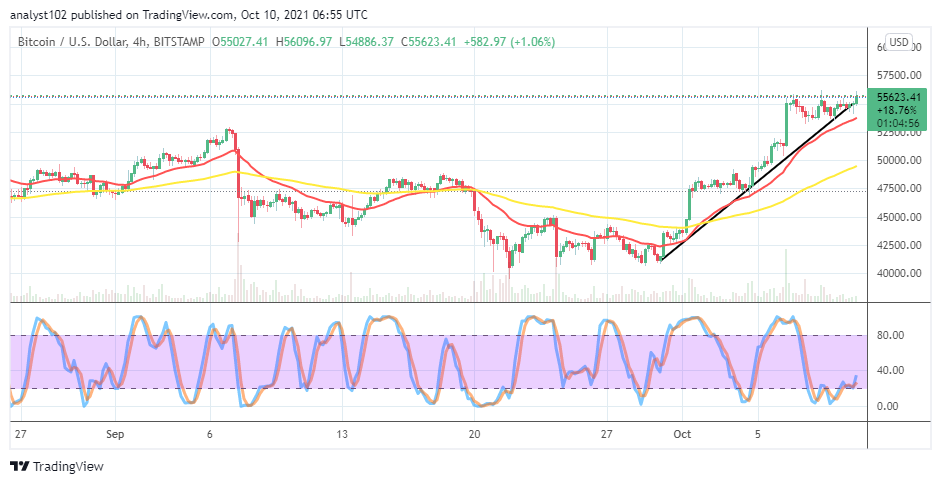
BTC/USD 4-hour Chart
The BCT/USD 4-hour chart also reveals that the crypto-economic market experiences a pump in its price valuation. A chain of variant candlesticks has formed around a $55,000 line, showcasing a kind of convergences. That depicts that the market is somewhat experiencing a pit stop in its present trading time. The 14-day SMA indicator is over the 50-day SMA trend line as they point to the upside. The Stochastic Oscillators open the lines slightly to the north side within the ranges of 40 and 20. The market may still go a bit further northward before it can encounter resistance. An intensive motion away from the $55,000 level will cause trading in other zones. A downward reversal against the value line will give bears better chances to reposition their presence in the market.
Note: Cryptosignals.org is not a financial advisor. Do your research before investing your funds in any financial asset or presented product or event. We are not responsible for your investing results.
You can purchase crypto coins here. Buy Tokens