Bitcoin (BTC/USD) Market Eyes $50,000
Estimated Reading Time: 3 minutes
Don’t invest unless you’re prepared to lose all the money you invest. This is a high-risk investment and you are unlikely to be protected if something goes wrong. Take 2 minutes to learn more
Bitcoin Price Prediction – October 3
There has been an increase in the northward-moving of the BTC/USD’s price as the market eyes a $50,000 resistance line. The crypto economy trades around the line of $47,825 at an average rate of about 0.88 percent. That signifies that the northward-pushing degree of the crypto-fiat currency pair is at less-active motions as of writing.
BTC/USD Market
Key Levels:
Resistance levels: $50,000, $52,500, $55,000
Support levels: $42,500, $40,000, $37,500
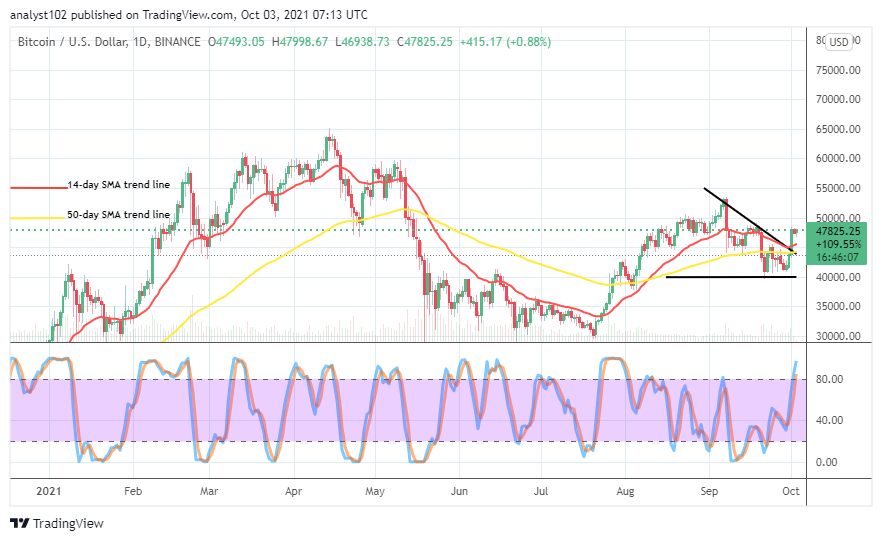
BTC/USD – Daily Chart
The BTC/USD daily chart showcases that the crypto-economic market eyes $50,000 resistance level as there has been an emergence of a bullish candlestick that formed above the SMA indicators. The 14-day SMA trend line has slightly bent toward the north at a close point above the 50-day SMA trend line. The Stochastic Oscillators have moved into the overbought region, seemingly trying to close the lines. That could mean that the market is likely to experience a pause in its price movements for a while.
Can the BTC/USD currency pair add more to its upward forces to achieve a higher valuation as the market eyes $50,000?
It is more likely that the BTC/USD currency pair to push toward achieving a higher valuation as the crypto-economic market eyes a $50,000 resistance level. It would be reasonable that the price is allowed to moves down toward $45,000 for the mustering of energy to the north side. Launching of long order after a breakout at the higher value-line mentioned earlier may summarily expose bulls to losing a stance on a correctional-moving process.
On the downside, the BTC/USD market bears will again have to be on the lookout for more active price reactions carrying a chain of rejections around the level of $50,000 before a sell position can observe. It could take some more days’ sessions prior that presumed assumption will play out. On the contrary, if the subsequent days’ sessions end with a succession of variant bullish candlesticks. Then, sell orders will have to suspend until a few days.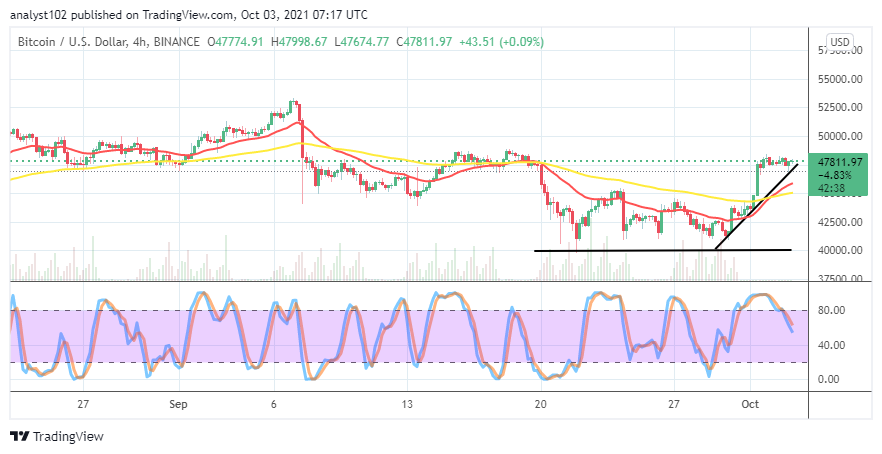
BTC/USD 4-hour Chart
The BCT/USD 4-hour chart depicts that the crypto market eyes $50,000 as it has slightly breached northward past the $47,500 level. It is currently more visible on the medium-term chart that the market witnesses a line of price convergences close over the lower point latterly mentioned. The 14-day SMA indicator has recently intercepted the 50-day SMA indicator to the upside. The Stochastic Oscillators are on a slow-moving mode to the south direction in a slanting manner, averaging the range of 40. That signifies that the crypto coin is relaxing in its strength as traded against the US fiat currency. But, there has been no sign of the definite direction that the market may go, going by the reading of the present situation.
Note: Cryptosignals.org is not a financial advisor. Do your research before investing your funds in any financial asset or presented product or event. We are not responsible for your investing results.
You can purchase crypto coins here. Buy Tokens