Bitcoin (BTC/USD) Market Heightens Rallying Forces
Estimated Reading Time: 3 minutes
Don’t invest unless you’re prepared to lose all the money you invest. This is a high-risk investment and you are unlikely to be protected if something goes wrong. Take 2 minutes to learn more
Bitcoin Price Prediction – January 26
Presently, it noticed that the BTC/USD market heightens its rallying forces, having been able to find stances around $35,000 during the recent free fall-offs that have caused some traits of panic. The crypto-economic price now trades within the high of $38,570 and the low of $36,607, maintaining the pace of 3.62 percentage rate positively.
BTC/USD Market
Key Levels:
Resistance levels: $40,000, $42,500, $45,000
Support levels: $35,000, $32,500, $30,000
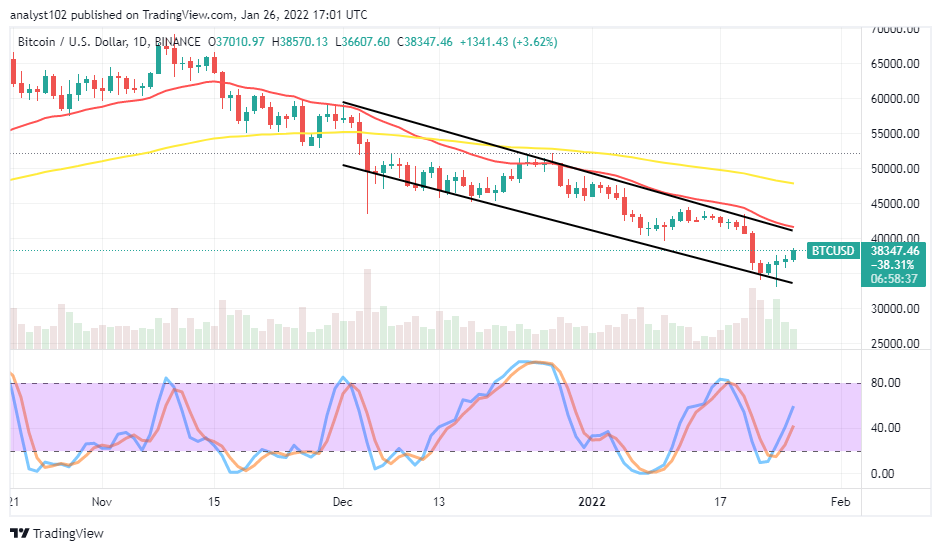
BTC/USD – Daily Chart
The BTC/USD daily chart exhibits the crypto-economic market heightens rallying forces toward the resistance at $40,000. A set of smaller bullish candlesticks has taken up shapes, denoting the possibility of price reaching the value line in no time if the current pace of slow-and-steady upward force isn’t lost. The upper bearish channel trend line drew alongside the smaller SMA trend line. The 50-day SMA indicator is above the 14-day SMA indicator. The Stochastic Oscillators are weakly swerving their lines northbound to signify the possibility of seeing the market reversing in its upward momentums gathering process in no time.
Will the BTC/USD trade activities continually push past the $40,000 for gathering momentums as the market heightens its rallying forces toward it presently?
It seems any attempt of the BTC/USD trade upward movers past the $40,000 resistance level may not bag a sustainable outlook above it even as the market heightens its rallying forces toward the value line presently. At this point, it may have been too late for the long-position takers of the crypto economy to join the ride to the resistance point mentioned earlier.
On the downside of the technical analysis, despite the dominance of the rallying forces in the BTC/USD market operations currently, short-position takers still have the chance of taking a re-launch of their stances around the $40,000 resistance level as price progress toward it. A lower time chart can be used for spotting a timely entry after the price might have reached an overbought trading condition, giving a set of bearish candlesticks showing convergence to project a sell order afterward.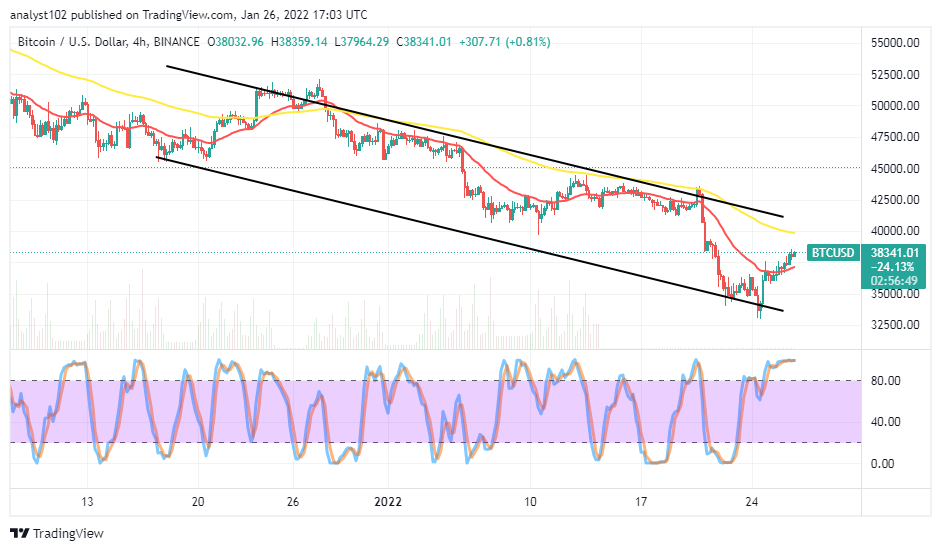
BTC/USD 4-hour Chart
The BTC/USD 4-hour chart shows the crypto market heightens rallying forces between $37,500 and $40,000 levels. The 14-day SMA indicator has briefly bent northward beneath the 50-day SMA indicator. The bearish channel trend lines are drawn to embody the SMAs. The Stochastic Oscillators are in the overbought region, clogging northbound further within. That indicates the rallying forces have not exhausted as of writing. However, long-position takers should be wary of exerting a buy order at this point.
Note: Cryptosignals.org is not a financial advisor. Do your research before investing your funds in any financial asset or presented product or event. We are not responsible for your investing results.
You can purchase crypto coins here. Buy Tokens