Bitcoin (BTC/USD) Market Holds Below $40,000
Estimated Reading Time: 3 minutes
Don’t invest unless you’re prepared to lose all the money you invest. This is a high-risk investment and you are unlikely to be protected if something goes wrong. Take 2 minutes to learn more
Bitcoin Price Prediction – January 30
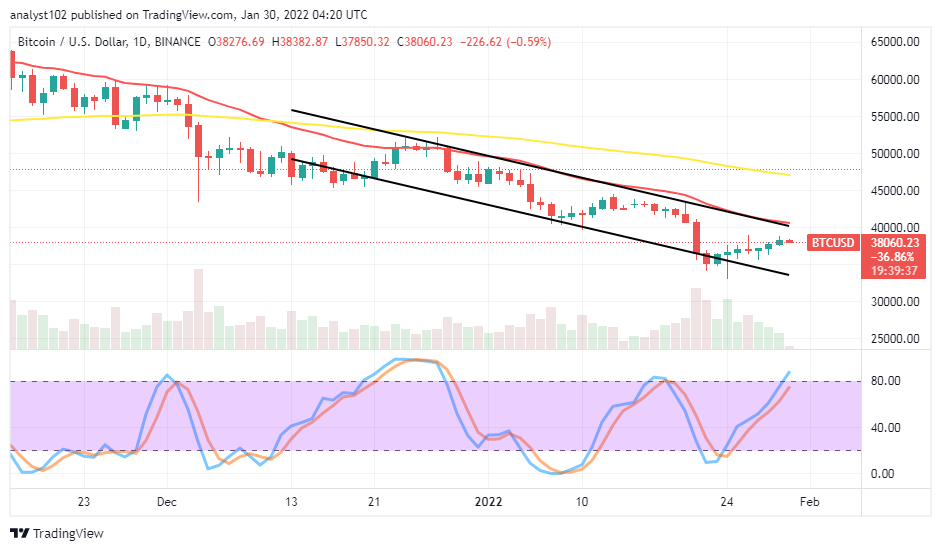
There have been several attempts to see the BTC/USD price pushes northward in a rallying motion as the crypto-economic market holds below $40,000. Presently, price trades at $38060 in the high and low of about $38,382 and $37,850, keeping a minute negative percentage rate of 0.59.
BTC/USD Market
Key Levels:
Resistance levels: $40,000, $42,500, $45,000
Support levels: $35,000, $32,500, $30,500
BTC/USD – Daily Chart
The BTC/USD daily chart shows the crypto market holds below the $40,000 resistance level as it has to surge higher in its rallying motions over a couple of sessions. The bearish channel trend lines drew southward as the smaller SMA indicator trends alongside the upper side. The 50-day SMA trend line is above the 14-day SMA trend line. The Stochastic Oscillators have managed to move into the overbought region briefly past the range of 80. That indicates the crypto economy may soon pause its rallying motion efforts.
Is the BTC/USD trade’s current rallying capacity worthy of joining to the upside as the market holds below $40,000?
Going by the reading of the Stochastic Oscillators as stated achievement of an overbought trading condition in the BTC/USD operations presently, it may not be too technically sound well to join the rallying motion as the market holds below $40,000 resistance level closely. Sudden hiking of price against the value line could potentially bring an end to the rallying forces so far if not sustained. Therefore, buyers needed to be wary of joining at that time to catch along such a motion to the north side to avoid an unnecessary whipsawed trading situation.
On the downside of the technical analysis, it is expected that the $40,000 resistance level remains vital to getting a retarding trading moment to further rallying motion efforts of the crypto economy. Based on that assumption, it would be of much importance to the BTC/USD trade sellers to be alert of when there will be an active price rejection around the point to consider the launching of a shorting order.
BTC/USD 4-hour Chart
The BTC/USD 4-hour chart shows the crypto market holds below the $40,000 trading level as the price has embarked upon a rallying motion over a couple of operations. The 50-day SMA trend line is above the 14-day SMA trend line. A smaller candlestick has emerged, having a top shadow after hitting the bigger SMA form beneath to indicate that the market now encounters a rejection moment. The Stochastic Oscillators are in the overbought region with their lines clogged, trying to face southbound. That suggests the possibility of seeing a downward move soon in the market.
Note: Cryptosignals.org is not a financial advisor. Do your research before investing your funds in any financial asset or presented product or event. We are not responsible for your investing results.
You can purchase crypto coins here. Buy Tokens