Bitcoin (BTC/USD) Market Index Relaxes Below $20,000
Estimated Reading Time: 3 minutes
Don’t invest unless you’re prepared to lose all the money you invest. This is a high-risk investment and you are unlikely to be protected if something goes wrong. Take 2 minutes to learn more

Free Crypto Signals Channel
Bitcoin Price Prediction – October 12
In what looks like a continuation of trying to rebuild stances at a lower-trading spot in the BTC/USD trade activities, the crypto market index relaxes below the $20,000 line. The present trading outlook possesses relatively negative signs between $19,217.65 and $18,990.83 value points at a minute percentage rate of 0.18.
BTC/USD Market
Key Levels:
Resistance levels: $22,500, $25,500, $27,500
Support levels: $17,500, $15,000, $12,500
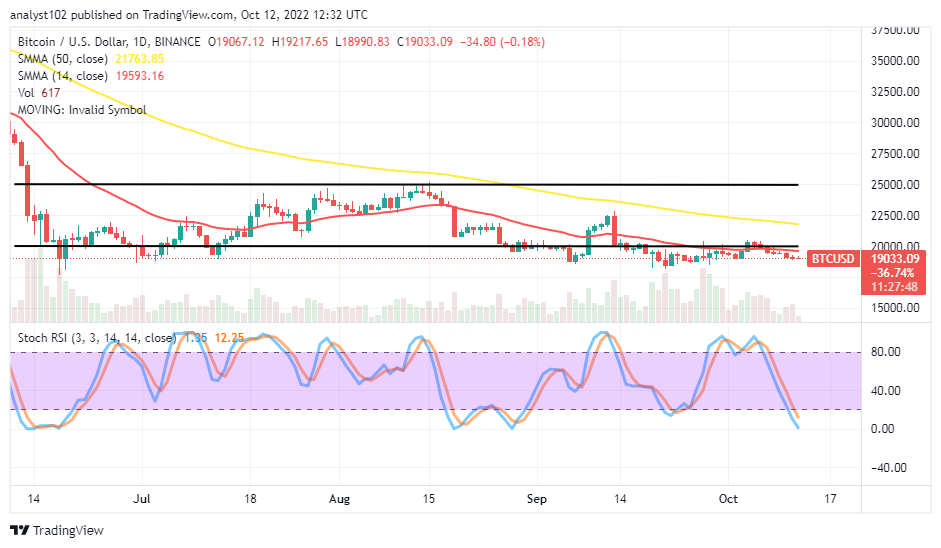
BTC/USD – Daily Chart
The daily chart shows the BTC/USD market index relaxes below the $20,000 psychological level. The lower horizontal line remains drawn at the value line as the 14-day SMA trend line has slightly gone past the downside, keeping a point of $19,593.16 underneath the $21,763.85 value line of the 50-day SMA trend line. The Stochastic Oscillators have dipped into the oversold region, touching the range values of 12.25 and 1.35 to signify the market is about to find a baseline to make an upswing in no time.
Can the bears in the BTC/USD trade use more effort to push the price farther lower, below $20,000?
As of the time of writing, there is no indication supporting the BTC/USD trade bears will deploy more pressures to obtain a sustainable lower point below the 420,000 level as the market index relaxes below the value line. Buyers are bound to make a comeback after finding support toward the $17,500 if the price fails to go down with a gravitational weight afterward to the south.
On the downside of the technical analysis, it has indicated the leftover depressions currently in the BTC/USD market transaction are fastly heading to a notable lower-trading zone to determine the exhaustion of the capacity of bears in the near time. That presumption makes it theoretically optimal for sellers to put their short positions on hold at this time.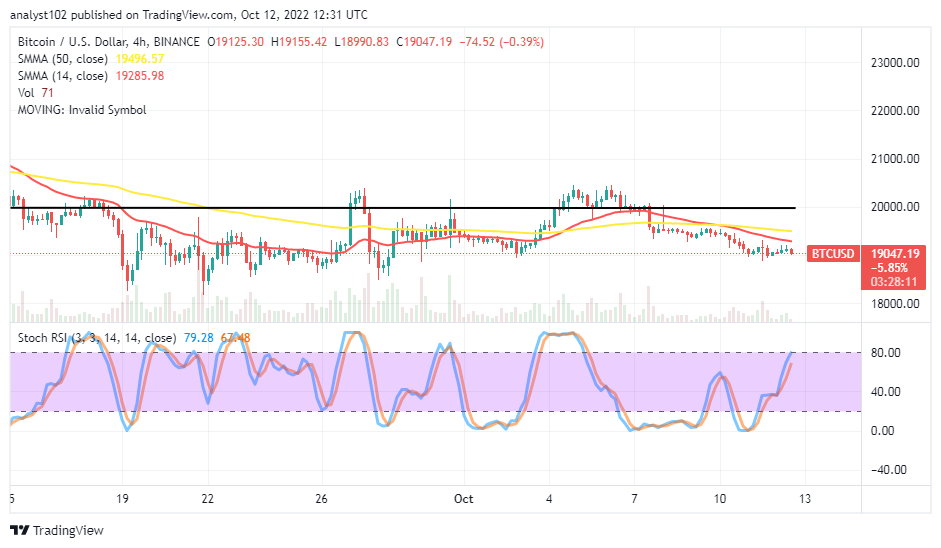
BTC/USD 4-hour Chart
The BTC/USD medium-term chart showcases that the crypto-market index relaxes below the $20,000 trading level. The 14-day SMA indicator has traveled southward against the 50-day SMA indicator from around the value line. They are both closely over the SMA indicators. The Stochastic Oscillators have struggled to move northbound from the oversold region to the range points of 67.48 and 79.28. It suggests that the cryptocurrency market may take some time to bounce toward the north.
Note: Cryptosignals.org is not a financial advisor. Do your research before investing your funds in any financial asset or presented product or event. We are not responsible for your investing results.
You can purchase Lucky Block here. Buy LBLOCK