Bitcoin (BTC/USD) Market Makes Efforts to Swing Upward
Estimated Reading Time: 3 minutes
Don’t invest unless you’re prepared to lose all the money you invest. This is a high-risk investment and you are unlikely to be protected if something goes wrong. Take 2 minutes to learn more

Free Crypto Signals Channel
Bitcoin Price Prediction – April 27
The BTC/USD market makes efforts to swing upward sequence to a falling force during yesterday’s sessions. Price is trading in the $39,303 and $37,899 at a positive percentage rate of 2.33. All the figures showcase a promising upward-moving motion returning soon.
BTC/USD Market
Key Levels:
Resistance levels: $42,500, $47,500, $50,000
Support levels: $37,500, $35,000, $32,500
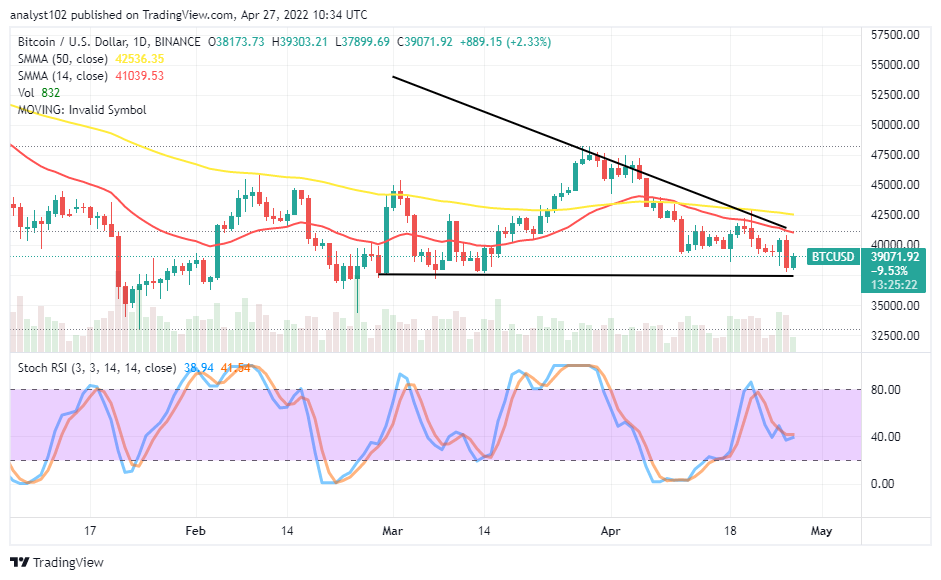
BTC/USD – Daily Chart
The BTC/USD daily chart reveals the crypto-economic market makes efforts to swing upward following a chain of declining moves in the last several hours. The positioning of the SMAs signifies the crypto business operation still trades under depression. The 14-day SMA indicator is underneath the 50-day SMA indicator. A bearish candlestick emerged during yesterday’s downing motion, averaging the $37,500 critical support. The Stochastic Oscillators are like making an effort to either conjoin or cross their lines around the 40 range.
Can there be sustainable upward moves in the BTC/USD price as the crypto-economic market strives to swing upward from a lower-trading zone?
It still appears the BTC/USD trade is on the threshold of trying to rebuild its stance from the $37,500 level as a falling pressure re-surfaced during yesterday’s operations. The crypto-economic market strives to swing upward from an area close to the value line. 1-hour time frame will enable traders to have a timely foresight of when price action is about to feature in the market. A rebounding move emanating from a downward motion has to be observed by buyers before considering the execution of an order.
On the downside of the technical analysis, the BTC/USD market sellers may not have a better advantage to keep shorting positions for the long term, especially while the crypto economy holds against further free sell-offs around the $37,500 critical support level afterward. Based on that analytics presumption, shorting of positions tend not to have the catalyst to keep long underneath the value-line.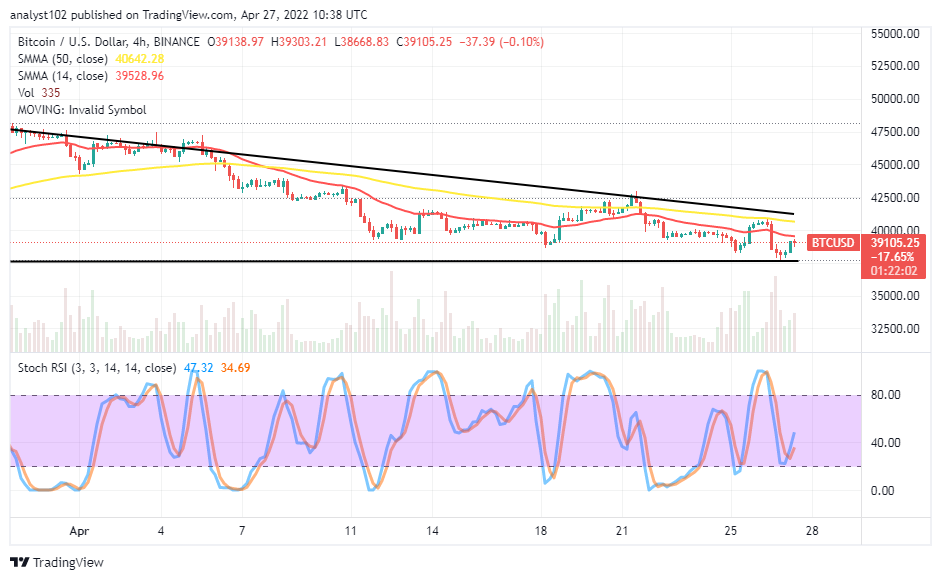
BTC/USD 4-hour Chart
The BTC/USD 4-hour chart shows the crypto-economic market strives to swing upward after finding support closely above the $37,500 critical support baseline. The descending triangular pattern drawn encloses the SMA trend lines, showing the US Dollar is still relatively dominating the business activities as of writing. The 14-day SMA trend line is underneath the 50-day SMA trend line. The Stochastic Oscillators have crossed their lines northbound from the range of 20 slightly against the 40 range line. That signifies an upward force is imminent.
Note: Cryptosignals.org is not a financial advisor. Do your research before investing your funds in any financial asset or presented product or event. We are not responsible for your investing results.
You can purchase Lucky Block here. Buy LBlock: