Bitcoin (BTC/USD) Market Sets a New High Trading Zone
Estimated Reading Time: 3 minutes
Don’t invest unless you’re prepared to lose all the money you invest. This is a high-risk investment and you are unlikely to be protected if something goes wrong. Take 2 minutes to learn more

Free Crypto Signals Channel
Bitcoin Price Prediction – March 30
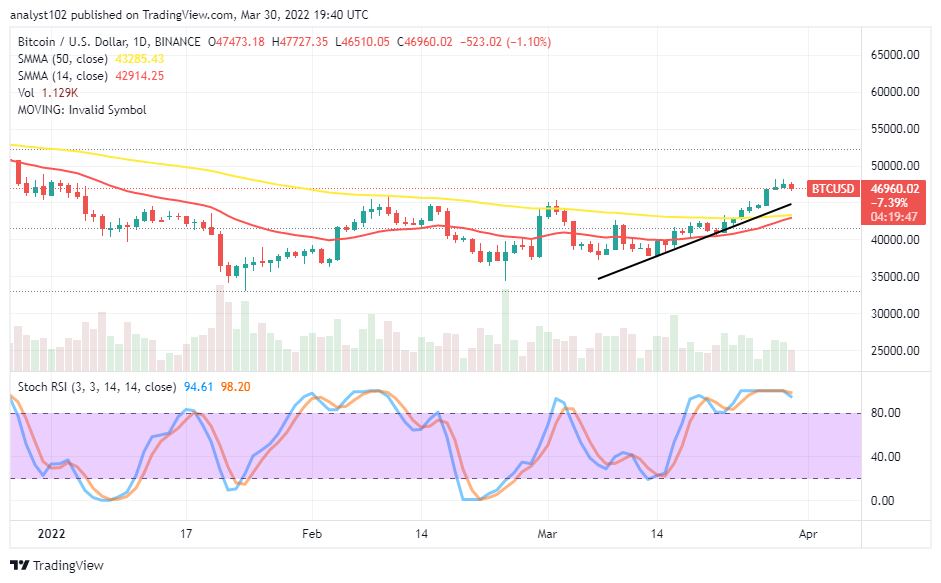
The current rallying price motion in the BTC/USD trading activities has been for a while as the market sets a new high trading zone around $47,500. Presently, the crypto economy trades at $46,960 between $47,727 and $46,510 at an average percentage rate of 1.10 negatives.
BTC/USD Market
Key Levels:
Resistance levels: $47,500, $50,000, $52,500
Support levels: $45,000, $42,500, $40,000
BTC/USD – Daily Chart
The BTC/USD daily chart shows the crypto-economic market sets a new high trading zone around the $47,500 resistance level. The 14-day SMA indicator has bent northwardly closely to the 50-day SMA indicator from beneath. The bullish trend line relatively drew northwardly to ascertain the path of the rallying motion. The Stochastic Oscillators are in the overbought region, moving in a consolidation manner. And there has been a slight curve to the southbound within it.
Will the BTC/USD trade activities rally furthermore past the $47,500 level as the market sets a new high trading zone?
The long-term show a slight rejection around the $47,500 trading level as the market sets a new high trading zone. The situation is now garnering momentum against sustainable upward forces. That signifies that long-position takers may not have to stop executing new long orders to avoid unnecessary bulls’ traps in the long run.
On the downside of the technical analysis, the BTC/USD market short-position takers heeded to be on the lookout for any possible price correction around or below the $50,000 resistance level to consider a selling order. The market rallying motion appears to have reached the highest point, warranting a necessary drawback in values. If that assumption has to play out following our expectation, it has to be between $47,500 and around a high value of $50,000 resistances.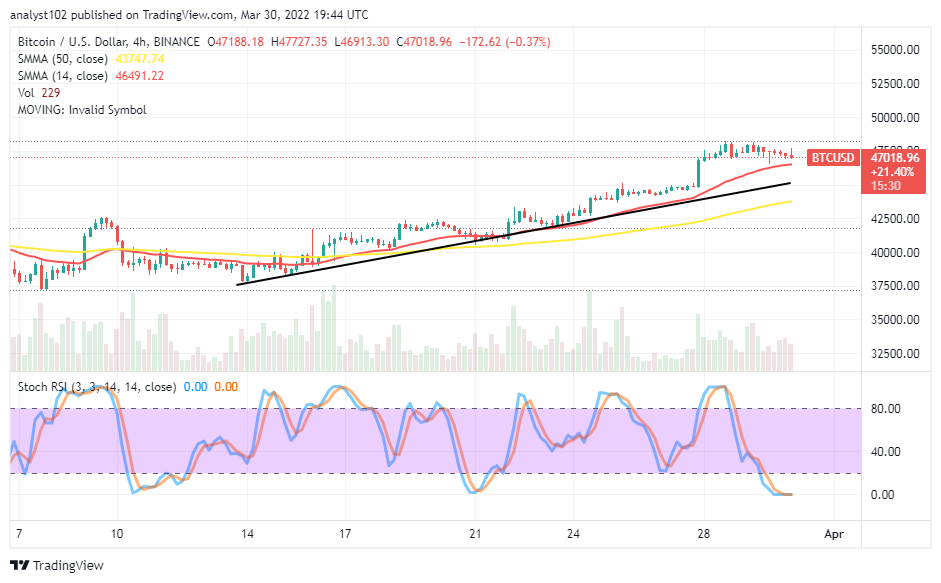
BTC/USD 4-hour Chart
The BTC/USD medium-term chart shows the crypto-economic market sets a new high-trading zone as the price continues to push northwardly. The bullish trend line drew to affirm the trend is in a bullish outlook. The 14-day SMA indicator is above the 50-day SMA indicator. The Stochastic Oscillators are in the oversold region, clogging the lines at the range line of zero. Variant candlesticks are now featuring in the form of rejections around the $47,500. But, the Oscillator suggests that the pattern lacks the strength to push to the downside.
Note: Cryptosignals.org is not a financial advisor. Do your research before investing your funds in any financial asset or presented product or event. We are not responsible for your investing results.
You can purchase Lucky Block here. Buy LBlock: